
Social media has become an essential component of any modern business strategy, and its impact can be measured through effective social media analytics reporting. Social media analytics reports provide insights into social media performance, identify trends, and help businesses make data-driven decisions.
Understanding the metrics that matter most to your business can help you optimize your social media strategy, improve engagement, and increase your return on investment (ROI). In this guide, we will explore how to create an effective social media analytics report that can help you track your social media performance and optimize your social media strategy.
What is Social Media Analytics Reporting?
Social media analytics reporting refers to the process of analyzing social media data to gain insights into social media performance. It involves collecting and analyzing data from various social media platforms such as Facebook, Twitter, Instagram, LinkedIn, and YouTube to understand how a business is performing on social media.
Social media reporting helps businesses identify trends, track key performance indicators (KPIs), and make data-driven decisions to optimize their social media strategy.
So, how to track social media analytics? Some areas that are commonly found in a social media report template include:
- Audience Insights: Demographic information about your followers, such as age, gender, location, and interests.
- Engagement Metrics: Metrics that measure the level of engagement on your social media content, such as likes, comments, shares, and clicks.
- Reach and Impressions: Metrics that measure how many people have seen your social media content and how many times it has been viewed.
- Conversions: Metrics that measure how many people have taken action on your social media content, such as visiting your website, filling out a form, or making a purchase.
- Brand Sentiment: Metrics that measure the overall sentiment towards your brand on social media.
- Competitor Analysis: Comparing your social media performance to your competitors to identify areas for improvement.
Key Metrics for Social Media Reporting
An effective social media analytics report should include key metrics that provide insights into social media performance. Some of the most important metrics to include in social media reporting are:
- Post Count: The number of social media posts published within a specific time frame.
- Impressions: The number of times users have seen your social media content.
- Likes/Favorites: The number of likes, favorites, or hearts received on your social media posts.
- Followers: The number of followers your social media account has.
- Engagement Rate: The rate at which users interact with your social media content, calculated as a percentage of total impressions.
- Growth: The rate at which your social media account is growing, measured by the number of new followers gained over a specific time frame.
- Comments: The number of comments left on your social media posts.
- Leads: The number of leads generated through social media, such as form fills or sign-ups.
- Number of Interactions: The total number of interactions with your social media content, including likes, comments, shares, and clicks.
- Video Views: The number of times users have viewed your video content.
Steps to Create Social Media Analytics Report
Step 1: Determine Your Audience
Before creating a social media analytics report, it's crucial to identify the audience that will be receiving and reviewing the report. Knowing your audience helps you tailor your report to their needs and preferences.
Step 2: Focus on Your Reporting
Once you've identified your audience, focus your reporting on the specific goals and objectives that are relevant to them. This helps ensure that the report provides valuable, actionable, relevant insights.
Step 3: Choose Your Metrics
Select the most relevant metrics to track and report on. Metrics may include engagement rates, reach, impressions, and click-through rates (CTR). The metrics selected should align with the goals and objectives identified in Step 2.
Step 4: Gather Your Data
Select the most relevant metrics to track and report on. Metrics may include engagement rates, reach, impressions, and click-through rates (CTR). The metrics selected should align with the goals and objectives identified in Step 2.
Collect data from various sources such as social media platforms, website analytics tools, and third-party analytic tools for social media. Ensure that the data is accurate and up-to-date.
For example, CTRs and clicks can be gathered from Google Analytics or social media platform analytics.
Step 5: Analyze Your Data
Once you have gathered your data, analyze it to gain insights into your social media performance. Look for trends, patterns, and outliers. Compare performance across different platforms, campaigns, or time periods.
Step 6: Present Your Findings
Present your findings in a clear and concise manner. Use graphs, charts, and visuals to help illustrate your points. Include insights and recommendations based on your analysis. The report should be easy to read, and the information should be presented in a relevant and actionable way for the intended audience.
Social Media Analytics Reporting Tools
Numerous social media analytics reporting tools available in the market can help you analyze and present your social media data effectively. These tools offer various features, such as data visualization, customizable reporting templates, real-time monitoring, and advanced metrics tracking.
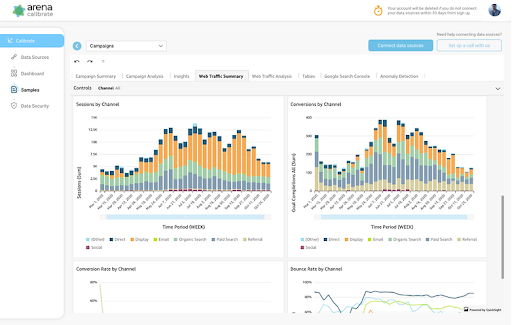
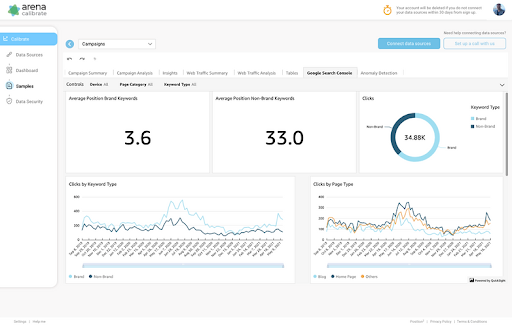
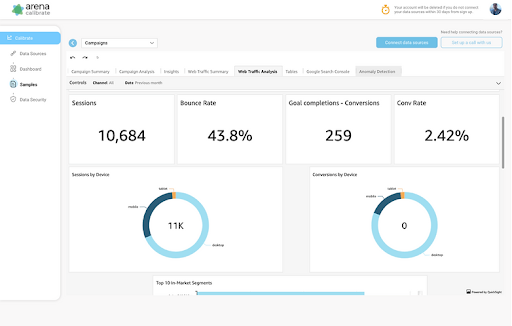
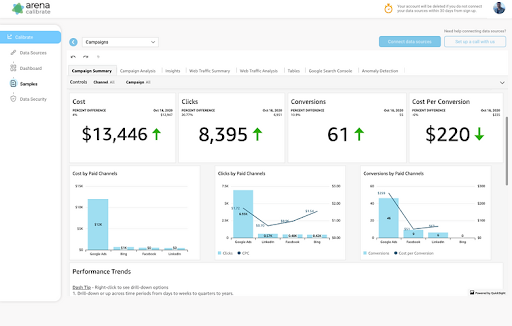
Arena Calibrate
Arena Calibrate is a comprehensive data analysis, modeling, and simulation platform that enables businesses to optimize their operations, production processes, and supply chains.
It provides powerful tools to help businesses collect, organize, and analyze data from multiple sources and make data-driven decisions to improve their operations.
Key features
- Simulation tools for predicting outcomes and optimizing processes.
- Data analysis and modeling tools for identifying bottlenecks and improving efficiency.
- Integration with third-party data sources for a comprehensive view of operations.
- Real-time analytics and reporting for quick decision-making.
Pricing
The cost of Arena Calibrate can vary based on factors such as the organization's size, the number of users, the features and functionalities needed, and the level of customer support required.
However, Arena Solutions offers a free trial of Arena Calibrate, which allows businesses to test the software before making a purchase decision. You can visit the website to get started.
Google Analytics
Google Analytics is a free web analytics tool that helps businesses track and analyze website traffic and user behavior. Its powerful features provide valuable insights into audience demographics, user behavior, and acquisition channels, making it an essential tool for any business looking to optimize its online presence.
Key Features:
Some of the key features of Google Analytics include tracking website traffic and behavior, monitoring key metrics such as bounce rates, conversion rates, and time on site, tracking user engagement with website content, and analyzing user demographics and behavior.
It also provides robust reporting capabilities with customizable dashboards, real-time data tracking, and integration with other Google tools, such as AdWords.
Pricing:
Google Analytics is a free tool, making it an affordable option for businesses of any size. However, for businesses with more complex reporting needs or larger amounts of website traffic, there are paid options available with more advanced features and support.
Buffer Analyze
Buffer Analyze is a social media analytics tool that helps businesses track their performance on various social media platforms. It provides insights on metrics such as engagement, reach, and follower growth, helping businesses to understand what's working and what's not.
Key features
The key features of Buffer Analyze include the ability to track and analyze key metrics such as post performance, engagement, and follower growth across multiple social media platforms. It also allows users to schedule reports to be sent at regular intervals, so they can stay on top of their social media performance without having to log in to the tool every day.
Other features include custom dashboards, data filtering, and the ability to export data to CSV or PDF formats.
Pricing
Buffer Analyze offers several pricing plans based on the number of social media accounts and features required. Prices start at $35 per month for the Pro plan, which includes analytics for up to 8 social media accounts and basic reporting features.
The Premium plan starts at $50 per month and includes additional features such as custom reports and team collaboration tools. A 14-day free trial is available for all plans.
Sprout Social
Sprout Social is a comprehensive social media management and analytics tool that allows businesses to manage their social media presence and track their performance efficiently. Some of its main highlights include its intuitive user interface, detailed reporting capabilities, and robust social media listening and engagement features.
Key features
Sprout Social's key features include an all-in-one inbox that allows users to manage and respond to messages from multiple social media platforms in one place, scheduling and publishing tools for content management, in-depth analytics and reporting, social media listening and engagement, and team collaboration and task management capabilities.
Pricing
Pricing for Sprout Social varies depending on the package and features selected, with plans starting at $99 per user per month for the Standard package and going up to $249 per user per month for the Advanced package.
A free 30-day trial is also available for those who want to test out the platform before committing to a subscription.
Hootsuite
Hootsuite is a popular social media management tool that offers social media analytics capabilities. Some of the highlights of Hootsuite include its ability to manage multiple social media accounts, schedule and publish content, and monitor brand mentions and social media conversations.
Key features
Hootsuite's key features for social media analytics include customizable dashboards, real-time data tracking, and social media metrics such as engagement rate, impressions, and clicks. It also offers sentiment analysis, which helps businesses understand how customers perceive their brand on social media.
Pricing
Hootsuite offers a variety of pricing plans for businesses of different sizes and needs. Its plans start at $19 per month for individual users and go up to custom pricing for enterprise-level businesses. Hootsuite also offers a 30-day free trial for its professional and team plans.
Semrush
SEMrush is a comprehensive digital marketing platform that includes social media analytics reporting as one of its key features. It offers a range of social media measurement tools to help businesses improve their online presence and track their social media performance.
Key features
SEMrush's social media analytics reporting tool allows businesses to track key metrics such as follower growth, engagement rate, and post-performance across multiple social media platforms.
It also provides insights into competitors' social media strategies and performance, helping businesses stay ahead of the competition.
Pricing
SEMrush offers a range of pricing plans starting from $119.95 per month for its Pro plan, up to $449.95 per month for its Business plan. It also offers a custom pricing plan for enterprises with specific needs.
A free trial is available for new users to test out the platform's features before committing to a paid plan.
Ahrefs
Ahrefs is an SEO tool that is also used for social media analytics reporting. Ahrefs is known for its powerful backlink analysis, keyword research, and competitive analysis tools. It allows users to track and analyze social media metrics such as likes, shares, and comments across multiple platforms.
With Ahrefs' social media metrics, users can easily identify what content is performing well and what content needs improvement.
Key features
Ahrefs' key features include social media metrics tracking, content analysis, and competitor research. Its social media metrics tracking feature allows users to track their social media profiles and compare their performance against their competitors.
With Ahrefs' content analysis feature, users can analyze their content's performance and identify what content is performing well and what needs improvement. Ahrefs' competitor research feature allows users to gain insights into their competitors' content strategies and identify opportunities to improve their own strategies.
Pricing
Ahrefs offers four pricing plans: Lite, Standard, Advanced, and Agency. The Lite plan starts at $99 per month and includes access to Ahrefs' core features, such as site explorer and keyword explorer.
The Standard plan starts at $179 per month and includes access to Ahrefs' advanced features, such as content explorer and rank tracker. The Advanced plan starts at $399 per month and includes access to Ahrefs' most advanced features, such as site audit and historical data.
Finally, the Agency plan starts at $999 per month and includes all of Ahrefs' features plus access to API and additional user accounts.
Moz
Moz is a powerful SEO and content marketing tool offering extensive features to help businesses improve their online presence. It offers a range of capabilities, including keyword research, site optimization, and link analysis.
Key features
One of the key features of Moz is its comprehensive keyword research tool that allows users to find relevant keywords for their website or content. The tool also provides insights into the keyword difficulty and competition level, helping businesses to make informed decisions about which keywords to target.
Other key features of Moz include site auditing, on-page optimization, and link building.
Pricing
Moz offers several pricing plans, including a free trial, and standard, medium, large, and premium plans. The pricing of Moz depends on the plan selected, with the premium plan being the most expensive.
Moz is a great option for businesses that want a comprehensive suite of SEO and content marketing tools to help them improve their online presence.
Supermetrics
Supermetrics is a powerful reporting tool that allows users to connect with their social media accounts, advertising platforms, and web analytics tools to gather data in one place. The platform offers a wide range of data connectors, including Facebook, Instagram, Twitter, Google Analytics, Google Ads, and more, making extracting data from multiple sources easy.
Key features
Some of the key features of Supermetrics include automated report generation, custom dashboard creation, and advanced data visualization options. Users can easily visualize data in the form of graphs, charts, and tables and share the reports with their team or clients.
Supermetrics also offers a range of pre-built report templates, making it easy to get started with reporting.
Pricing
Supermetrics offers flexible pricing options, including subscription plans starting at $19 per month and custom enterprise pricing options for larger organizations. The platform also offers a free trial, allowing users to test out the features before committing to a paid subscription.
Overall, Supermetrics is a great choice for businesses and agencies looking to streamline their social media reporting and gather data from multiple sources in one place.
SEO Reporting Samples
SEO reporting should summarize and visualize data related to search engine optimization efforts. These reports should showcase key metrics, performance trends, and insights to communicate the impact of SEO strategies effectively.
Some common elements found in SEO reporting samples include:
Organic Traffic
Showcase the overall traffic coming from organic search and highlight any significant changes or trends.
Keyword Rankings
Display the rankings of target keywords and track their progress over time.
Backlink Analysis
Present the number and quality of backlinks, emphasizing any notable gains or losses.
On-Page Optimization
Highlight the optimization efforts made on specific pages and their impact on search visibility.
Technical SEO Audit
Summarize the findings from a website audit, focusing on areas that require attention or improvement.
Conversion Metrics
Include conversion data, such as leads or sales generated from organic search traffic, to demonstrate the impact on business goals.
Competitor Analysis
Provide insights into competitors' SEO strategies, comparing metrics and identifying opportunities.
These samples serve as a guide to create clear, concise, and visually appealing reports that effectively communicate the progress and results of SEO efforts.
Conclusion:
Creating an effective social media analytics report requires a well-defined approach that takes into account the audience, the metrics to be tracked, and the tools used to gather and analyze data.
Social media performance reporting is essential for understanding how a brand's social media efforts are performing, identifying areas for improvement, and making informed decisions based on data. By following the steps outlined in this guide and utilizing the various social media analytics reporting tools available, businesses can effectively measure their social media performance and optimize their social media strategy to achieve their goals.
Ultimately, the insights gained from social media analytics reporting can help businesses improve their online presence, increase engagement, and drive meaningful results.
FAQs On Social Media Analytics Report
How can you measure the impact of social media analytics?
Measuring the impact of social media analytics involves tracking the performance of social media marketing efforts against established goals and objectives. To measure the impact of social media analytics, there are a few key metrics to consider, such as:
- Engagement rate: This measures the level of interaction on social media posts, such as likes, comments, and shares. A high engagement rate indicates that the content is resonating with the audience.ar
- Conversion rate: This measures the number of social media users who take a desired action, such as filling out a form, making a purchase, or signing up for a newsletter.
- Click-through rate (CTR): This measures the percentage of people who click on a link within a social media post or ad and land on the intended webpage.
- Return on investment (ROI): This measures the financial return on social media marketing efforts, such as revenue generated from social media campaigns.
By tracking these metrics and analyzing the data, businesses can determine the impact of their social media analytics and make informed decisions about their social media marketing strategies.
What should be included in a social media analytic report?
A social media analytics report should include key metrics such as post count, impressions, reach, engagement rate, growth, followers, likes, comments, leads, number of interactions, video views, and click-through rates.
It should also include an analysis of the data collected, insights drawn from the data, and recommendations for future actions based on the insights. The report should be presented clearly and visually appealingly, using charts, graphs, and other visual aids to help stakeholders easily understand the data and insights.
Additionally, the report should be tailored to the intended audience, providing relevant information and insights that will be useful for their specific needs and objectives.
What are ways to measure social media performance?
There are several ways to measure social media performance, including:
- Follower growth: The number of followers your social media account gains over a specific period of time.
- Engagement: The level of interaction users have with your social media content, including likes, comments, shares, and retweets.
- Impressions: The number of times users have seen your social media content.
- Reach: The number of unique users who have seen your social media content.
- Click-through rate (CTR): The percentage of users who clicked on a link in your social media post.
- Conversion rate: The percentage of users who completed a desired action, such as making a purchase or filling out a form, after clicking on a link in your social media post.
- Sentiment analysis: The measurement of how users feel about your brand, product, or service based on their social media posts and comments.
- Influencer mentions: The number of times influential social media users have mentioned your brand or product.
- Customer service response time: The speed and quality of your responses to customer inquiries and complaints on social media.
- Social media advertising metrics: The effectiveness of your social media advertising campaigns, including ad impressions, clicks, and conversions.
What are the basic elements of a good social media monitoring report for our client?
A good social media monitoring report for a client should include the following basic elements:
- Executive Summary: A brief overview of the report that highlights the key metrics and insights.
- Objectives and KPIs: A clear description of the objectives and key performance indicators (KPIs) that were tracked during the reporting period.
- Social Media Channels: An overview of the social media channels that were monitored, including the number of posts, engagement rates, and reach.
- Performance Metrics: A detailed analysis of the performance metrics, such as impressions, engagement, click-through rates, conversion rates, sentiment analysis, and follower growth.
- Competitive Analysis: An analysis of the client's performance against their competitors, including benchmarking against industry standards.
- Insights and Recommendations: Actionable insights and recommendations based on the data, including optimization suggestions and opportunities for improvement.
- Data Visualization: Visual representations of the data, such as charts, graphs, and tables, make it easy for the client to understand and interpret the results.
- Appendices: Additional data, such as raw data sets and social media account information, supports the report's findings and recommendations.


