| Data Connector | Arena Calibrate | Power BI |
|---|---|---|
| Databases | Amazon Redshift, Google BigQuery, MySQL, PostgreSQL, Salesforce, SQL Server, Snowflake | Amazon Redshift, Google BigQuery, MySQL, PostgreSQL, Salesforce, SQL Server, Snowflake, Azure SQL Database, Azure Synapse Analytics, IBM Db2, Teradata, SAP HANA |
| Files | CSV, JSON, PDF, text files | CSV, JSON, PDF, text files |
| Web services | Google Analytics, HubSpot, Marketo, Mixpanel, Salesforce | Google Analytics, Adobe Analytics, Marketo, Mixpanel, Salesforce |
| Cloud-based services | Azure Data Lake Storage, Azure Data Explorer (Kusto), Azure Blob Storage, Azure Table Storage, Azure Cosmos DB | Azure Data Lake Storage, Azure Data Explorer (Kusto), Azure Blob Storage, Azure Table Storage, Azure Cosmos DB |
| On-premises gateways | Yes | Yes |
| Custom connectors | Yes | Yes |
- Introduction
- User Interface and experience
- Data connectivity and sources
- Data visualization
- Advanced features and functionalities
- Performance and Scalability
- Customer support and documentation
- Pricing
- Microsoft Power BI
- Summary
Exploring Power BI Alternatives: Arena Calibrate vs Power BI
The explosion of digital marketing has amplified the need for businesses to maintain a stronghold on their marketing efforts. Marketing dashboards have now become a crucial asset to any business wanting to keep a finger on the pulse of all marketing activities.
But with so many dashboards showcasing exceptional and diverse functionalities and features, finding the right one can be overwhelming. Power BI has grabbed much of the spotlight in recent years, rewarding users with a stronger grip on their data analysis.
As popular as the dashboard has become, there are many general-purpose tools like Power BI that can fulfill the same data analysis needs. Arena Calibrate, however, is a specialized solution that’s designed to level up your marketing analytics with its tailored features, focused approach, and hyper-responsive business intelligence (BI) support team.
But what solution is optimal for you?
Well below, we’re going to investigate further to help you determine the best fit for your specific analytical needs.
We’ll compare the most vital aspects of these platforms, including data connectivity, user interface, visualization capabilities, and more, to equip you with the insights needed to make data-driven marketing decisions at speed.
1. Overview of Arena Calibrate and Power BI
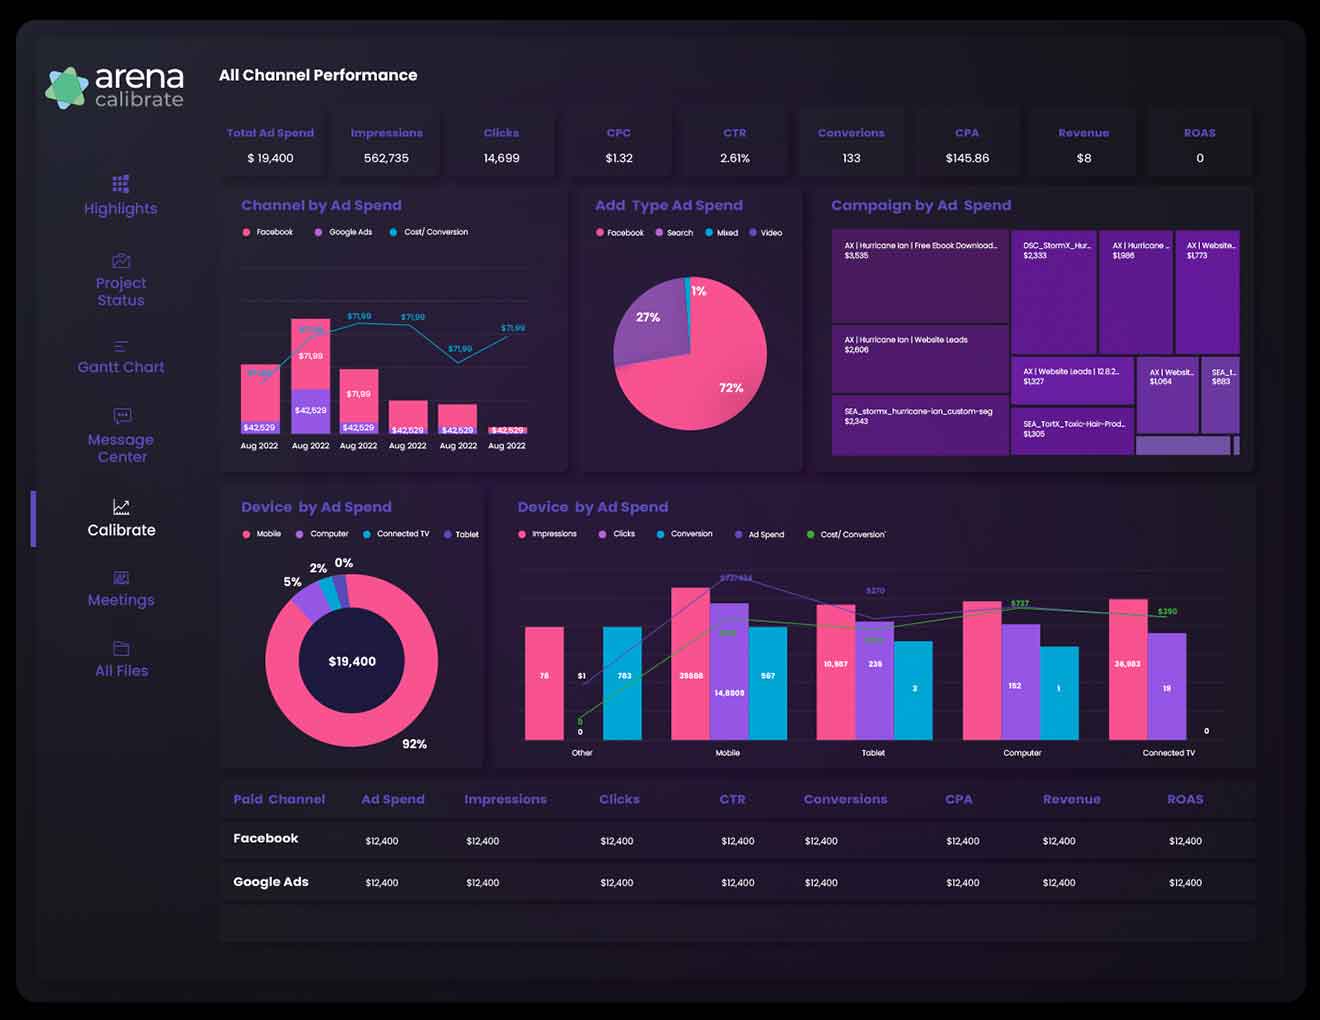
Arena Calibrate is a hybrid dashboard solution that pulls data from different marketing campaigns into one location. From just a glance, key decision-makers can understand the overall performance of their marketing activity, allowing them to make data-driven decisions at speed.
With this dashboard, you can track website traffic, social media engagement, and email marketing performance without having to dig through multiple sources or complicated data sets.
What’s more, is that Arena Calibrate is a customizable solution. Businesses can use the Arena Calibrate team to set up, create, and tailor the dashboard to allow them to maximize their dashboard potential.
In the other camp, we have Microsoft Power BI - a more general but powerful business intelligence solution that can be used for a variety of purposes, including:
- marketing analytics
- sales forecasting, and
- financial reporting
It's well-suited to various industries and business functions, including finance, operations, sales, and marketing. Its compatibility with Microsoft products can provide seamless integration within organizations heavily invested in the Microsoft ecosystem.
Despite sharing a number of characteristics, both Arena Calibrate and Microsoft BI are uniquely different and offer distinct benefits to businesses based on their specific goals and objectives.
2. User Interface and experience
Arena Calibrate
Arena Calibrate has an intuitive and modern user interface that prioritizes user-friendliness and efficient navigation. This is reflected in its clean design and well-organized layout that allows marketers to seamlessly operate the dashboard, even with zero technical expertise.
The ease of use of Arena Calibrate almost unlocks a padlock that would exist with many other marketing dashboards, allowing you to fully tap into its features and functionalities – irrespective of how much technical experience you have.
The user-centric approach is further reiterated through its user-friendly drag-and-drop interface that enables you to effortlessly arrange visual elements, charts, and data components.
Navigating through different sections of the dashboard is straightforward, and the user-centric design ensures that key features and tools are easily accessible. The Microsoft Power BI alternative has an interface that’s designed to be responsive, allowing users to access and interact with their dashboards on various devices without compromising the visual appeal or functionality.
Microsoft Power BI
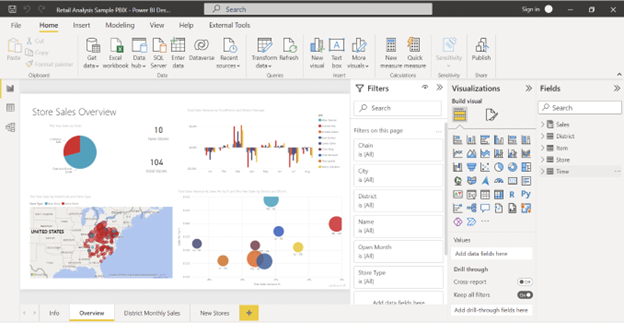
Microsoft Power BI has also placed user-friendliness at the top of its priorities, making it easy to use, navigate, and extract valuable insights from complex data sets. It’s essentially Excel pivot tables that are integrated with advanced data visualization tools and capabilities.
Once you've imported data into a Power BI dataset, creating meaningful charts, graphs, and tables to interpret the data is relatively straightforward. There is no deep end to jump in here – especially if you have basic Excel skills.
The platform is often valued for its familiarity, especially for organizations already using other Microsoft products, which accelerates the adoption process and reduces the learning curve for those accustomed to Microsoft's ecosystem.
But what about the aesthetics? Well, it’s sleek, modern, and visually appealing – just like many alternatives to Power BI. Navigation within Power BI is straightforward and well-structured – the availability of pre-built templates and visuals simplifies the process of creating informative reports.
With regards to functionality, Power BI is renowned for its robust features and capabilities, enabling users to perform complex data analysis and create insightful visualizations. The platform's interactive nature fosters dynamic exploration of data, allowing users to drill down into details and gain deeper insights.
3. Data connectivity and sources
Every facet, every characteristic, and every feature of Arena Calibrate is created to help businesses maximize their marketing data analytics potential. This makes Arena Calibrate one of the leading Power BI competitors when it comes to harnessing the full capability of marketing data insights.
With Arena Calibrate, you have over 60 data connectors that encompass all of the heavyweight marketing platforms.
Power BI has slightly more, offering 74 data connectors across different industries. Just like many other tools like Power BI, the dashboard is able to connect with more general platforms that are outside of the marketing sphere.
Power BI offers a wider range of data connectors than Arena Calibrate. However, Arena Calibrate does offer some connectors that Power BI does not, such as HubSpot and Marketo.
Ultimately, the best data connector for you will depend on your specific needs and requirements. If you need to connect to a wide range of data sources, Power BI is a good choice. If you need to connect to specific marketing platforms, Arena Calibrate may be a better option.
4. Data visualization
Both Arena Calibrate and Power BI offer a variety of data visualization tools that can be used to create interactive and informative reports. However, there are some key differences between the two platforms in terms of the quality of their visualizations, chart types, customization options, and interactive features.
Chart Types
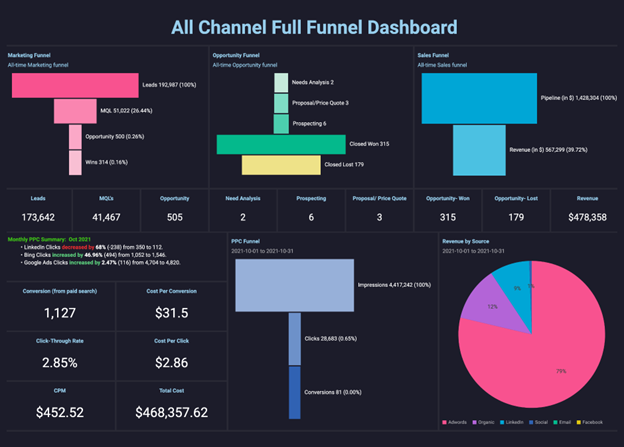
Arena Calibrate offers a wider range of chart types than Power BI. This includes more specialized charts for marketing analytics, such as funnel charts and heatmaps. Power BI, on the other hand, focuses on more general-purpose charts, such as line charts, bar charts, and pie charts.
Customization options
Users of both solutions have the freedom to personalize their dashboard to suit their preferences. Here are some of the features they have in common:
- Themes: customize the look and feel of your reports and dashboards with the pre-built themes. You can also create your own custom themes.
- Visualizations: personalize the appearance of each visualization with the different colors, fonts, and shapes available.
- Filters: filter your data to show only the information that you want to see. You can create custom filters or use the filters provided.
- Bookmarks: save specific views of your reports and dashboards to revisit or share particular insights with other team members.
- Comments: add comments to your reports and dashboards to collaborate with others or to provide feedback.
Here are some of the customization options Arena Calibrate offers that Microsoft Power BI does not:
- Data Blending: blend data from multiple sources into a single visualization. This is useful for creating more comprehensive and informative reports.
- Smart Insights: use machine learning to automatically identify patterns and trends in your data. This can help you to quickly identify areas for improvement and make better decisions.
Being designed for marketers, Arena Calibrate offers more customization options for its visuals than Power BI to allow key decision-makers to quickly identify relationships and patterns. As a result, there’s a more diverse coloring scheme to enhance data differentiation and facilitate more intuitive data interpretation within Arena Calibrate.
Interactive Features
Both Arena Calibrate and Power BI spoil users with an array of interactive features that make their respective dashboards easier to use. These include:
- Filters allow users to quickly and easily view data for a specific subset of users, time period, or other criteria.
- Drill down enables users to explore data at a deeper level by clicking on individual elements in a chart or table.
- Highlight allows users to highlight specific data points in a chart or table, making them easier to see.
- Tooltips provide additional information about data points when users hover over them.
- Annotations allow users to add custom text or images to charts and tables.
- Custom interactions allow users to establish personalized interactions, such as the ability to create maps or timelines.
Despite sharing a number of commonalities between their interactive features, there are a number of key differences between the two platforms.
Here is a table that summarizes the key differences between the interactive features of Arena Calibrate and Power BI:
| Feature | Arena Calibrate | Power BI |
|---|---|---|
| Filters | Enhanced flexibility for applying filters to charts, tables, or entire dashboards. | Less flexible filters that can only be applied to entire dashboards. |
| Slicers | More powerful slicers can be used to dynamically filter data by selecting specific values from a list. | Less powerful slicers can only be used to filter data by selecting specific values from a list. |
| Drill down | Extensive drill-down capability for in-depth exploration through individual chart or table elements. | Less granular drill-down that only allows users to drill down to related tables. |
| Highlight | Robust highlighting to emphasize and improve the visibility of specific chart or table data points. | It is a less powerful highlight that only allows users to highlight specific data points in a chart or table. |
| Tooltips | Informative tooltips with additional data insights upon hovering over data points. | Less informative tooltips that only provide the value of a data point. |
| Annotations | Versatile annotations enabling custom text or image additions to charts and tables. | Less versatile annotations that only allow users to add custom text to charts and tables. |
| Custom interactions | Powerful custom interactions for creating sophisticated user-specific dashboards. | Less powerful custom interactions that are limited to creating maps and timelines. |
5. Advanced features and functionalities
Arena Calibrate Features:
- Enhanced Data Modeling offers advanced tools for modeling data. Users can create custom dimensions and measurements and establish complex relationships between different data tables. This is particularly useful for businesses needing to analyze intricate data.
- Machine Learning Capabilities include various machine learning features. Users can create models to predict outcomes and forecast future trends. This is valuable for businesses making decisions based on data.
- Effortless Collaboration facilitates easy teamwork by allowing users to share reports and collaborate on them in real-time. This is a great fit for businesses aiming to share insights and information effectively.
- Integration Flexibility integrates with popular business applications like Salesforce, Marketo, and HubSpot. This is advantageous for businesses seeking to connect their BI platform with their existing systems.
Microsoft Power BI Offerings:
- Power BI Premium: is an advanced version of Power BI that offers additional features. Users can publish reports on the web and create customized visuals. This is ideal for businesses that need to share reports widely or want unique visualizations.
- Power BI Embedded: is a part of Power BI that lets businesses incorporate Power BI reports into their own applications. This is a good choice for businesses that want tailor-made dashboards and reports.
- Power BI Mobile: is a mobile app that enables users to view Power BI reports on their smartphones and tablets. This is useful for businesses that want to provide their employees with access to Power BI reports while they are on the move.
- Power BI APIs: allow businesses to programmatically access Power BI data and reports. This is valuable for businesses aiming to integrate Power BI with their existing systems.
Top-down summary of features
| Features | Arena Calibrate | Power BI |
|---|---|---|
| Advanced data modeling | Yes | Yes |
| Machine learning | Yes | Yes |
| Collaboration | Yes | Yes |
| Integrations | Yes | Yes |
| Power BI Premium | No | Yes |
| Power BI Embedded | No | Yes |
| Power BI Mobile | No | Yes |
| Power BI APIs | No | Yes |
6. Performance and Scalability
Microsoft Power BI:
Power BI demonstrates a high level of performance through its user-friendly interface and seamless integration with Microsoft's suite of tools. Its centralized architecture simplifies data connectivity and sharing, making it a suitable choice for businesses seeking a convenient reporting solution.
Perhaps Power BI's strength lies in its ability to swiftly generate visually appealing reports and dashboards, making data interpretation accessible. However, its performance might encounter limitations when handling very large datasets and intricate queries. Scalability could potentially be a concern for organizations dealing with substantial data growth.
Arena Calibrate:
Not many Power BI competitors will have the edge when it comes to performance. However, this is an area where Arena Calibrate excels because of its distributed architecture that spreads the workload across multiple servers. This design allows it to handle extensive datasets and intricate queries. With its parallel processing and its efficient way of using resources, users are able to scale more easily with this dashboard, making it a strong Microsoft Power BI alternative for enterprises grappling with significant data volumes and complex analysis.
Moreover, Arena Calibrate's performance optimization features, such as caching and partitioning, add more horsepower to its engine, enabling smoother and faster data processing. What does this mean? Maximum responsiveness. Quicker insights. Faster decision-making.
| Features | Arena Calibrate | Power BI |
|---|---|---|
| Architecture | Distributed | Centralized |
| Performance | Better for handling large datasets and complex queries | Better for small to medium datasets and simple queries |
| Scalability | Better for scaling to handle large datasets and a high number of users | It can be difficult to scale to handle large datasets and a high number of users |
| Cost | More expensive | Less expensive |
| Ease of use | More difficult to use | Easier to use |
| Integrations | Integrates with fewer business applications | Integrates with more business applications |
| Community | Smaller community | Larger community |
7. Customer support and documentation
Being a product of Microsoft, Power BI inherently offers a vast amount of online resources aimed at helping users tackle platform challenges on their own. This self-reliance is further bolstered by the wealth of online forums where users can share insights, ask questions, and receive guidance from fellow users and dedicated Microsoft staff.
It’s a collaborative environment that facilitates learning, problem-solving, and the exchange of best practices, ensuring that users can confidently navigate any hurdles they encounter.
Arena Calibrate also offers a wealth of documentation, but the online forums are not as big and comprehensive as Power BI’s. However, Arena Calibrate isn’t just software – it’s part of a package of services that makes the dashboard integration process as efficient and seamless as possible.
This liberates users from the heavy burden of tackling the technical complexities in the dashboard setup process. preserving time and energy while reducing the risk of future errors. What’s more is that users can outline A-Z of how they want their dashboard to be personalized, allowing them to maximize the full potential of their analytics.
8. Pricing
Arena Calibrate
Arena Calibrate is a managed service solution, so there isn’t a one-size-fits-all pricing model for users. This is because every business is unique, differing in size as well as needs and objectives, requiring a different amount of time and effort to be invested in the backend.
As a result, the pricing is bespoke to each client and is determined by the following factors (see right table). Businesses are able to request a quote.
| Features | |
|---|---|
| Data Source Integration | Cross-Channel Reporting in Standard Templates |
| Data Warehousing | Reporting Template Set Up & Customization Support |
| Reporting / Dashboard Platform Usage | Data Connector Maintenance |
| Number of Standard data sources | Multi-Channel Data Source Alignment & Blending |
| Number of Advanced data sources | New Reporting, Executive Reporting, and Customization Support |
Microsoft Power BI
Microsoft Power BI has a variety of pricing plans to fit the needs of businesses of all sizes. They are as follows:
Power BI Free
Power BI Free offers cost-free access to powerful data visualization tools. Users can download the software, connect diverse data sources, and craft interactive dashboards. It enables KPI tracking, enhancing insights, and complementing Microsoft Dynamics 365 functionalities for comprehensive business analysis.
Power BI Pro - $10 per user/month
Power BI Pro provides users with advanced content sharing and collaboration options, enabling viewing and interaction with published reports, dashboard creation as a team effort, centralized access and modification through Workspaces, and diverse roles (Admin, Member, Contributor, Viewer) for tailored access levels within Workspaces.
Power BI Premium: This plan is for businesses that need to scale their BI platform to handle large datasets and a high number of users. There are two pricing options for Power BI Premium:
- Power BI Premium per user: This option is $20 per user per month and includes all the features of Power BI Pro, plus the ability to scale to handle more data and users.
- Power BI Premium per capacity: This option is $4,995 per month and includes all the features of Power BI Pro, plus the ability to scale to handle even more data and users.
Summary
Both Arena Calibrate and Power BI are sophisticated business intelligence tools that have the capacity to propel companies closer to their goals. No longer do businesses have to compete in the digital arena with limited insights - you can revel in data nirvana and harness the full spectrum of information to make data-driven decisions at remarkable speed.
However, the choice between the two platforms depends on your goals and current needs. There are many general-purpose tools like Power BI, so if your organization is looking for a versatile solution spanning various business functions, Power BI's robust capabilities, diverse integrations, and wide-ranging data connectors make it a strong contender.
Arena Calibrate is a specialized marketing dashboard where A-Z of its features are created specifically to ensure that businesses maximize the analytics potential of their marketing campaigns.
Although there are many alternatives to Power BI, Arena Calibrate is the most powerful BI tool available and a solution that will propel your marketing efforts to new heights with its tailored capabilities and focused approach.
In as little as five days, you can have a tailored interactive dashboard set up for you exactly the way you want it, allowing you to make data-driven decisions with confidence and precision.