
In the ever-evolving landscape of data analytics and information presentation, data visualization tools have emerged as essential instruments for businesses, analysts, and decision-makers. As we step into 2023, the significance of these tools in translating complex datasets into comprehensible visual representations cannot be overstated.
In fact, according to a survey by Dresner Advisory Services, 62% of organizations consider data visualization a crucial component of their business intelligence initiatives. Hence, there’s no doubt that in 2023 and beyond, data visualization tools are anticipated to play a pivotal role in aiding organizations to navigate the complexities of big data, ensuring informed decision-making and competitive advantage.
This article aims to be your comprehensive guide, shedding light on the 10 best data visualization tools in 2023, equipping you with the knowledge you need to harness the power of data visualization effectively.
What are Data Visualization Tools?
Data visualization tools are software applications designed to transform raw data into visually appealing and easily understandable representations such as charts, graphs, dashboards, and maps. These tools play a critical role in simplifying complex datasets, enabling users to extract valuable insights, identify patterns, and make informed decisions.
By presenting data in a visual format, they enhance data comprehension, facilitate communication, and empower organizations and individuals to explore, analyze, and communicate information effectively.
10 Best Data Visualization Tools
1. Arena Calibrate
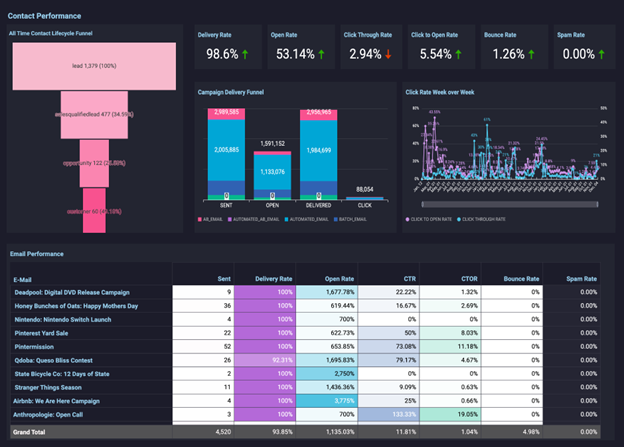
Arena Calibrate stands as a prominent contender among the best data visualization tools. Its robust capabilities empower users to transform complex datasets into compelling visual representations, facilitating data-driven decision-making. With a user-friendly interface and a suite of powerful features, it's a preferred choice for businesses seeking to unlock insights from their data.
Features:
- Data Integration: Seamlessly collect and integrate data from various sources.
- Customization: Tailor visualizations to match specific needs and objectives.
- Real-Time Updates: Access real-time data insights for agile decision-making.
- Comprehensive Chart Library: Choose from a wide range of chart types.
- Collaboration: Share and collaborate on visualizations with team members.
Pros:
- User-friendly interface for both beginners and advanced users.
- Robust customization options for tailored visualizations.
- Real-time data updates keep you informed.
- Extensive chart library for diverse visualization needs.
- Collaboration features enhance teamwork and data sharing.
Cons:
- Advanced features may have a steeper learning curve for beginners.
- Pricing information is not readily available and requires contacting the vendor.
- Some users may require additional training to leverage the tool's full potential.
| Features | Pros and cons |
|---|---|
| Sentiment Analysis | Goes beyond mere social listening and monitors dozens of sources |
| Trend Tracking | An astounding amount of data(12+ years worth) yields powerful insights |
| Influencer Identification | Data visualization is impressive in its ability to sum up the numbers at a glance |
| Report Customizability | Advanced boolean queries must be typed from scratch |
| Social Analytics | Overwhelming amount of data and filtering options require more than tech savvy to use the software |
Use Cases:
- Marketing Campaign Optimization: Arena Calibrate empowers marketing teams to track and analyze campaign performance, enabling data-driven decisions for optimizing ad spend, content, and targeting.
- Competitor Benchmarking: Users can conduct competitor analysis to gain valuable insights into market trends and competitor strategies, helping businesses stay ahead in their industries.
2. Looker Studio
Looker Studio is a dynamic data visualization tool known for its intuitive interface and powerful analytics capabilities. It empowers users to create compelling visualizations and gain deeper insights from their data, making it a valuable asset for data-driven organizations.
Features:
- Drag-and-Drop Interface: Looker Studio offers a user-friendly interface with drag-and-drop functionality, making it accessible for users of varying technical backgrounds.
- Customizable Dashboards: Users can create highly customizable dashboards with a wide range of visualization options, from charts and graphs to heatmaps and tables.
- Data Exploration: Looker Studio supports data exploration by allowing users to drill down into specific data points for a more granular analysis.
- Collaborative Workspace: It fosters collaboration with features like data sharing, commenting, and real-time collaboration, enabling teams to work seamlessly.
- Data Security: Robust security measures ensure that sensitive data remains protected and compliant with privacy regulations.
Pros:
- Intuitive interface for easy data visualization.
- Supports real-time data updates for timely insights.
- Strong focus on data governance and security.
- Integrates well with various data sources and platforms.
- Promotes collaboration among users.
Cons:
- Learning curve for advanced features.
- Cost may be a factor for smaller organizations.
- Limited offline functionality.
- Requires a solid data infrastructure for optimal performance.
Use Cases:
Looker Studio is ideal for businesses looking to:
- Enhance Data Discovery: Explore and visualize data to uncover hidden trends and insights, helping businesses make data-driven decisions.
- Monitor Key Metrics: Create customizable dashboards to track KPIs and metrics in real-time, aiding in performance monitoring and goal tracking.
3. Qlik Sense
Qlik Sense is a leading business intelligence and data visualization platform known for its user-friendly interface and robust data analytics capabilities. It empowers users to create interactive and visually compelling dashboards, facilitating data-driven decision-making for organizations.
Features:
- Drag-and-Drop Interface: Qlik Sense offers an intuitive drag-and-drop interface, making it accessible to a wide range of users.
- Associative Data Model: It uses an associative data model that enables users to explore data relationships freely.
- Self-Service Analytics: Users can create their dashboards, reports, and visualizations without heavy reliance on IT or technical expertise.
- Collaborative Analytics: Qlik Sense supports collaborative analytics, allowing users to share insights and collaborate in real-time.
- Data Integration: It seamlessly integrates with various data sources, both on-premises and in the cloud, to consolidate data for analysis.
Pros:
- User-friendly interface for self-service analytics.
- Powerful data exploration capabilities.
- Supports data storytelling and dynamic, interactive dashboards.
- Robust data security and governance features.
- Scalable for enterprise-level use.
Cons:
- Licensing costs can be high for large deployments.
- Learning curve for complex data modeling.
- Limited offline functionality.
- Requires a well-structured data architecture for optimal results.
Use Cases:
Qlik Sense is well-suited for:
- Business Intelligence and Reporting: Organizations can use Qlik Sense to generate insightful reports, track KPIs, and monitor business performance.
- Data Exploration and Analysis: Users can explore complex datasets, uncover patterns, and gain valuable insights into their data, aiding in strategic decision-making.
4. Datawrapper
Datawrapper is a web-based data visualization tool designed for simplicity and efficiency. It enables users to create a wide range of data visualizations, including charts, maps, and tables, without the need for extensive coding or design skills. Datawrapper is widely used by journalists, businesses, and researchers to convey data-driven stories and insights effectively.
- Easy-to-Use Interface: Datawrapper's user-friendly interface allows users to create visualizations quickly, even with limited technical expertise.
- Responsive Visuals: The tool generates responsive, mobile-friendly visuals that adapt to various screen sizes.
- Customization Options: Users can customize colors, labels, and fonts to match their branding or storytelling needs.
- Data Import: Datawrapper supports importing data from various sources, including spreadsheets, databases, and live data streams.
- Collaboration: Teams can collaborate on projects, and changes are automatically saved in real-time.
Pros:
- Rapid creation of visually appealing charts and maps.
- No coding or design skills required.
- Responsive design ensures compatibility across devices.
- Embedding options for easy sharing on websites and publications.
- Reliable data security and privacy.
Cons:
- Limited advanced features compared to some other tools.
- Free version has limitations on customization.
- May not be suitable for extremely complex or large-scale data projects.
- Limited offline functionality.
Use Cases:
Datawrapper is ideal for:
- News and Media: Journalists use Datawrapper to visualize data for news articles, reports, and interactive graphics, enhancing the storytelling of complex topics.
- Marketing and Business Reporting: Businesses utilize Datawrapper to create data visualizations for marketing campaigns, sales reports, and internal presentations, making data more accessible and engaging for stakeholders.
5. Tableau
Tableau is a renowned data visualization and business intelligence tool trusted by organizations worldwide. It empowers users to explore, analyze, and visualize data in a highly interactive and meaningful way, fostering data-driven decision-making.
Features:
- Drag-and-Drop Interface: Tableau offers an intuitive, drag-and-drop interface for easy visualizations.
- Real-Time Analytics: Users can connect to live data sources for real-time insights.
- Vast Visualization Options: Tableau provides a wide range of visualization types, from charts and graphs to maps and dashboards.
- Data Blending: It allows users to combine data from multiple sources for a holistic view.
- Embedded Analytics: Tableau can be integrated into other applications and websites.
Pros:
- Exceptional visualization capabilities.
- Wide support for various data sources.
- Robust community and resources for learning.
- Scalable for both small businesses and large enterprises.
- Strong data security features.
Cons:
- Costly licensing, particularly for enterprise editions.
- Steeper learning curve for advanced features.
- Requires a well-structured data source for optimal results.
- Limited offline functionality in some versions.
Use Cases:
Tableau is a versatile tool with applications in:
- Business Intelligence: Organizations use Tableau to create comprehensive dashboards and reports for monitoring business performance and making data-driven decisions.
- Data Exploration and Analysis: Data scientists and analysts employ Tableau to explore and analyze complex datasets, identifying trends, patterns, and outliers for deeper insights.
6. Zoho Analytics
Zoho Analytics is a robust cloud-based data analytics and visualization platform that caters to a wide spectrum of businesses and industries. It offers an array of tools for data preparation, analysis, and visualization, making it a versatile choice for organizations seeking to harness the power of their data.
Features:
- Data Integration: Zoho Analytics allows users to import data from various sources, including spreadsheets, databases, cloud storage, and online applications.
- Drag-and-Drop Builder: It offers an intuitive interface with drag-and-drop functionality for creating visualizations and reports.
- AI-Powered Insights: The platform utilizes AI and machine learning to provide automated insights, predictive analytics, and anomaly detection.
- Collaboration: Users can collaborate on reports and dashboards in real-time, fostering teamwork and data sharing.
- Customization: Zoho Analytics offers extensive customization options for visualizations and dashboards.
Pros:
- User-friendly interface suitable for non-technical users.
- Competitive pricing with a free tier for small-scale use.
- Integration with other Zoho products and third-party applications.
- Strong data security and encryption measures.
- Comprehensive customer support and training resources.
Cons:
- Advanced features may require a learning curve.
- Limited offline access to reports and dashboards.
- Some users may find the interface less polished compared to other premium tools.
- Integration with certain data sources may require additional configurations.
Use Cases:
Zoho Analytics finds applications in:
- Business Reporting: Organizations can create insightful reports and dashboards to monitor key performance indicators, track sales, and analyze financial data.
- Sales and Marketing Analytics: Sales teams utilize Zoho Analytics to evaluate sales performance, analyze customer behavior, and optimize marketing campaigns, aiding in data-driven decision-making and revenue growth.
7. Sisense
Sisense is a powerful business intelligence and data analytics platform known for its ability to simplify complex data into actionable insights. It offers an all-in-one solution for data preparation, analysis, and visualization, making it a preferred choice for businesses looking to harness their data effectively.
Features:
- Data Integration: Sisense allows users to easily connect to various data sources, including databases, cloud services, and spreadsheets.
- In-Chip Technology: Its unique In-Chip analytics engine accelerates data processing, enabling faster insights and real-time analytics.
- AI-Powered Analytics: Sisense employs AI and machine learning to offer predictive analytics, natural language processing, and data discovery.
- Custom Dashboards: Users can create highly customizable dashboards with interactive widgets and real-time data updates.
- Scalability: Sisense is designed to scale from small teams to large enterprises.
Pros:
- Exceptional data processing speed.
- Intuitive drag-and-drop interface for creating visuals.
- Robust AI-driven insights and recommendations.
- High level of data security and compliance.
- Strong customer support and community resources.
Cons:
- Pricing may be relatively high for smaller businesses.
- Learning curve for advanced analytics features.
- Limited offline access to data and dashboards.
- Integration with some data sources may require custom development.
Use Cases:
Sisense is well-suited for:
- Business Intelligence and Analytics: Organizations leverage Sisense to gain insights into their data, create performance reports, and support data-driven decision-making.
- Predictive Analytics: Data scientists and analysts use Sisense to build predictive models, uncover patterns, and make forecasts, enhancing strategic planning and resource allocation.
8. Domo
Domo is a cloud-based business intelligence and data visualization platform that offers a comprehensive suite of tools for data integration, analysis, and reporting. Designed for businesses of all sizes, Domo aims to simplify the process of turning data into actionable insights to drive informed decision-making.
Features:
- Data Integration: Domo allows users to connect and consolidate data from various sources, including databases, cloud services, and spreadsheets.
- Visual Data Exploration: Users can create interactive dashboards and reports with a drag-and-drop interface.
- Alerts and Notifications: Domo provides automated alerts and notifications for real-time monitoring of key metrics.
- Data Governance: The platform includes features for data security, access control, and compliance.
- Mobile Accessibility: Domo offers a mobile app for on-the-go data access and collaboration.
Pros:
- User-friendly interface for business users.
- Strong data integration capabilities.
- Robust collaboration and sharing options.
- Extensive library of pre-built connectors and integrations.
- Scalable for enterprise-level deployments.
Cons:
- Pricing may be relatively high for smaller businesses.
- Some users may find the learning curve for advanced features steep.
- Advanced analytics features may not be as robust as specialized analytics tools.
- Limited offline functionality.
Use Cases:
Domo serves a variety of use cases, including:
- Executive Dashboards: Business leaders use Domo to create executive dashboards that provide a real-time overview of company performance, enabling quick decision-making.
- Sales and Marketing Analytics: Sales and marketing teams utilize Domo to analyze customer data, track campaign performance, and optimize strategies, leading to improved customer engagement and revenue growth.
9. Power BI
Power BI is a popular business intelligence and data visualization tool developed by Microsoft. It empowers organizations to transform their data into rich, interactive reports and dashboards for better decision-making. With its user-friendly interface and integration with Microsoft's ecosystem, Power BI has become a go-to solution for data analytics.
Features:
- Data Connectivity: Power BI connects to a wide range of data sources, from databases to cloud services, and offers automatic data refresh.
- Interactive Visualizations: Users can create interactive charts, graphs, and maps, allowing for in-depth data exploration.
- Natural Language Query: Power BI supports natural language queries, enabling users to ask questions and receive visualized answers.
- Collaboration: Teams can collaborate on reports and dashboards, share insights, and make real-time decisions.
- AI-Powered Insights: The tool incorporates AI capabilities for predictive analytics, anomaly detection, and data modeling.
Pros:
- Seamless integration with Microsoft's ecosystem, including Office 365 and Azure.
- User-friendly interface with a low learning curve.
- Robust mobile app for on-the-go access to data.
- Strong community support and a vast library of pre-built templates and visuals.
- Scalable for both small businesses and large enterprises.
Cons:
- Advanced features may require technical expertise.
- Some users may find the licensing costs prohibitive for extensive use.
- Limited offline access to reports and dashboards.
- Performance may be impacted with extremely large datasets.
Use Cases:
Power BI is versatile and widely used for:
- Business Reporting: Organizations utilize Power BI to create comprehensive reports and dashboards for monitoring performance, financial analysis, and business intelligence.
- Sales and Marketing Analytics: Sales and marketing teams leverage Power BI to analyze sales data, track marketing campaign effectiveness, and optimize lead generation, leading to improved customer engagement and revenue growth.
10. Klipfolio
Klipfolio is a cloud-based business dashboard platform that specializes in real-time data visualization and reporting. It is designed to help businesses track key performance metrics and make data-driven decisions through visually engaging dashboards and visualizations.
Features:
- Data Integration: Klipfolio offers connections to various data sources, enabling users to consolidate information from multiple platforms.
- KPI Dashboards: Users can create highly customizable KPI dashboards with real-time updates.
- Pre-built Visualizations: The platform provides a library of pre-built charts, graphs, and metrics for faster dashboard creation.
- Custom Formula Editor: Klipfolio includes a formula editor for creating custom calculations and metrics.
- Sharing and Collaboration: Teams can collaborate on dashboard creation and share insights with others.
Pros:
- Intuitive drag-and-drop dashboard builder.
- Strong emphasis on real-time data updates and alerts.
- Competitive pricing for small to medium-sized businesses.
- Responsive design for mobile and tablet access.
- Extensive support for data connectors and APIs.
Cons:
- May have a steeper learning curve for complex data manipulations.
- Advanced features may not be as robust as some other tools.
- Limited offline functionality.
- Smaller organizations might find the pricing less competitive at larger scales.
Use Cases:
Klipfolio is well-suited for:
- Performance Tracking: Businesses use Klipfolio to monitor and visualize key performance metrics, providing real-time insights into areas such as sales, marketing, and operations.
- Digital Marketing Analytics: Digital marketing teams leverage Klipfolio to track campaign performance, website traffic, and social media engagement, allowing them to adjust strategies and improve ROI based on data-driven insights.
Why Data Visualization Tools are Important?
Data visualization tools are crucial because they transform raw data into visually comprehensible and actionable insights. By representing complex information in charts, graphs, and dashboards, these tools facilitate quicker and more effective decision-making. They enable users to spot trends, patterns, and outliers, fostering a deeper understanding of data.
Moreover, data visualization enhances communication within organizations, making it easier to convey information, identify opportunities, and address challenges, ultimately driving productivity and strategic growth.
Criteria for Selecting the Best Data Visualization Tools
Here are some of the most important criteria to consider while selecting the best data visualization tools:
- User-Friendly: The best data visualization tools should have an intuitive and user-friendly interface, allowing both novice and experienced users to create visuals and explore data without a steep learning curve, ultimately promoting widespread adoption within an organization.
- Data Integration: Data integration capabilities are crucial, as the tool should seamlessly connect to various data sources, offering options for real-time or batch data updates, ensuring that users can work with the most up-to-date information.
- Features: Comprehensive features encompassing a wide range of visualization types, advanced analytics, and customization options empower users to effectively represent and analyze data according to their specific needs and project requirements.
- Dashboard Appearance: Aesthetic dashboard appearance, with customizable layouts, themes, and interactive elements, plays a vital role in ensuring that the visualizations are engaging, easy to understand, and effective in conveying insights to stakeholders.
- Flexibility: Flexibility in terms of adaptability to changing data sources and requirements ensures that the tool remains relevant and can evolve along with the organization's data needs and dynamic business environment.
- Assistance: Robust assistance through documentation, tutorials, and responsive customer support is essential to help users troubleshoot issues, learn new features, and maximize the tool's potential for effective data visualization.
- Collaboration and Sharing: Tools should offer collaboration and sharing features that facilitate real-time collaboration among teams, allowing them to work together on projects, provide feedback, and easily share insights and dashboards with stakeholders, enhancing the decision-making process across the organization.
Benefits of Using Data Visualization Tools
Revealing Hidden Patterns
Data visualization tools excel at uncovering hidden patterns within data by representing complex information visually, making it easier for users to identify trends, outliers, and relationships that may not be apparent in raw data.
Streamlined Reporting and Contextualized Data
These tools streamline reporting processes by presenting data in a clear and contextualized manner, providing stakeholders with a comprehensive view of the information, which enhances understanding and facilitates more informed decision-making.
Swiftly Spotting Operational Correlations
Data visualization tools enable organizations to swiftly identify operational correlations, helping them understand cause-and-effect relationships, optimize processes, and make timely adjustments to improve efficiency and effectiveness.
Encouraging User Engagement with Data
By presenting data in visually appealing and interactive formats, data visualization tools encourage users to engage more deeply with data, fostering a culture of data-driven decision-making and increasing data utilization across an organization.
Increased Efficiency
These tools significantly increase efficiency by automating data processing, visualization, and analysis, reducing the time and effort required for manual data manipulation, ultimately leading to cost savings and improved productivity.
Making Smarter Business Decisions
Data visualization tools empower businesses to make smarter decisions based on data-driven insights, as they provide a clearer and more actionable view of information, facilitating strategic planning and informed choices.
Simplifying Trend Analysis
Data visualization tools simplify trend analysis by visualizing historical data in a format that is easy to interpret, allowing organizations to identify trends, patterns, and anomalies, which aids in forecasting and decision-making.
Enhancing Customer Sentiment Analysis
These tools enhance customer sentiment analysis by aggregating and visualizing customer feedback and sentiment data, enabling businesses to gain valuable insights into customer perceptions and preferences, and adjust strategies accordingly for improved customer satisfaction and loyalty.
Conclusion
Our exploration of the top 10 data visualization tools in 2023 has highlighted the pivotal role these tools play in transforming raw data into meaningful insights. With user-friendly interfaces, robust data integration capabilities, and a myriad of features, these tools empower organizations to reveal hidden patterns, streamline reporting, and make smarter business decisions.
By harnessing the power of data visualization, businesses can enhance their understanding of data, encourage data-driven decision-making, and ultimately gain a competitive edge in today's data-centric landscape. Embracing these tools is not just an option but a necessity for those seeking to unlock the full potential of their data for growth and innovation.
FAQ on Data Visualization Tools
What is the main reason for using data visualization tools?
The primary reason for using data visualization tools is to transform complex and often voluminous data into visual representations, such as charts, graphs, and dashboards, that are easy to understand and interpret. This visual simplification enables users to identify patterns, trends, outliers, and insights within data quickly, leading to better decision-making and enhanced communication of information to stakeholders.
What is the optimal method for data visualization?
The optimal method for data visualization depends on several factors, including the type of data, the audience, and the intended purpose. However, some key principles include choosing appropriate visualizations that effectively represent the data (e.g., bar charts for comparisons, line charts for trends), ensuring clarity and simplicity in design, and considering interactivity for deeper exploration. Additionally, it's essential to maintain data accuracy, use proper labeling, and provide context for meaningful interpretation.
Is Excel a data visualization tool?
Excel is indeed a data visualization tool to some extent. While it's primarily known as a spreadsheet software, Excel offers basic data visualization features such as creating charts and graphs. These can be effective for simple data sets or when quick visualization is needed. However, for more complex data analysis and advanced visualizations, dedicated data visualization tools like Tableau, Power BI, or others are often preferred due to their specialized capabilities.
What are the different data visualization tools?
There are numerous data visualization tools available, each with its unique features and strengths. Some of the popular ones include:
- Tableau
- Power BI
- QlikView/Qlik Sense
- Domo
- Looker
- Sisense
- Zoho Analytics
- Klipfolio
- Datawrapper
- Google Data Studio
Organizations choose these tools based on factors like their specific data needs, budget, ease of use, and integration with existing systems to effectively visualize and analyze their data.


