
In today's fast-paced business world, sales teams need to be equipped with the right tools to stay ahead of the competition. Customized dashboards are an essential tool that can help sales teams track their performance and make informed decisions to achieve their targets.
In this article, we will guide you through the process of creating custom dashboards for sales teams and explain why they are crucial for the success of your sales team.
Here are some stats and facts about the importance of custom dashboards for sales teams:
- Sales teams that use dashboards are 28% more likely to achieve their quotas than those that don't.
- 90% of sales teams that use dashboards report improved efficiency and productivity.
- The use of customized dashboards can increase sales team transparency and accountability, leading to better collaboration and communication.
What is a Sales Dashboard?
A sales dashboard is a visual representation of real-time sales data and key performance indicators (KPIs) that provide sales teams with a clear and concise overview of their performance. It is essential for tracking progress toward sales targets, identifying trends, and making informed decisions.
Sales KPI dashboards typically display information such as sales revenue, sales pipeline, conversion rates, and customer acquisition cost (CAC) in an easy-to-read format, allowing sales teams to assess their performance and quickly take action.
Benefits of using a Sales Dashboard
Sales dashboards offer numerous benefits to sales teams, including improved team collaboration, better customer relationship management, enhanced leads tracking, data-driven decision-making, real-time data availability, insights into sales performance, and accurate future predictions.
Team Collaboration
Sales dashboards promote team collaboration by providing real-time visibility into sales activities and performance. Team members can work together more effectively, share insights, and identify opportunities for improvement.
Customer Relationship Management
Sales dashboards enable teams to track and manage customer interactions, helping to build stronger relationships and increase customer loyalty. They provide valuable insights into customer behavior, preferences, and needs, allowing teams to tailor their approach and improve the customer experience.
Leads Tracking
Sales dashboards enable teams to track leads through the sales pipeline, identifying bottlenecks and optimizing the lead nurturing process. They provide visibility into the status of each lead and help teams prioritize their efforts to close deals faster.
Decision-Making
Sales dashboards provide real-time data and insights, enabling teams to make informed decisions quickly and effectively. They allow teams to identify trends and patterns in sales data, leading to more accurate forecasts and better decision-making.
Provides Real-Time Data
Sales dashboards provide real-time data and insights, enabling teams to stay up-to-date on the latest sales performance and KPIs. They allow teams to react quickly to changing market conditions and make data-driven decisions on the fly.
Sales Performance
Sales dashboards provide a clear view of sales performance, enabling teams to track progress toward goals and targets. They allow teams to identify areas for improvement and optimize sales processes, leading to increased productivity and revenue growth.
Future Predictions
Sales dashboards provide valuable insights into future sales performance, enabling teams to make informed forecasts and predictions. They allow teams to identify trends and patterns in sales data, leading to more accurate forecasts and better decision-making.
Crucial Sales Metrics to Optimize Your Dashboard for Growth
To optimize your sales metrics dashboard for growth, it is essential to focus on key metrics that can help you track and improve your sales performance. Some crucial sales metrics that you can include in your dashboard are:
Customer Acquisition Cost [CAC]
It measures the cost of acquiring a new customer and helps you understand the ROI of your marketing campaigns.
Open cases
It measures the number of open support cases, which helps you track customer satisfaction and identify areas for improvement.
Sales revenue growth
It tracks the growth of your sales revenue over time, helping you set and achieve revenue targets.
Sales by region or branch
It helps you identify which regions or branches are driving the most sales, allowing you to allocate resources effectively.
Open opportunities
It tracks the number of open sales opportunities, helping you prioritize and manage your sales pipeline effectively.
Opportunities past due
It measures the number of opportunities that are past their expected close date, which helps you identify areas for improvement in your sales process.
Closed opportunities
It tracks the number of closed sales opportunities and helps you understand your win/loss ratio.
Items per transaction
It measures the average number of items sold per transaction, helping you identify cross-selling and upselling opportunities.
Win/loss ratios
It tracks the percentage of closed opportunities that resulted in a win or loss, which helps you understand your sales performance and identify areas for improvement.
Sales funnel numbers by stage
It measures the number of opportunities at each sales funnel stage, helping you identify bottlenecks and optimize your sales process.
Open activities (calls, demos, visits)
It tracks the number of open sales activities, helping you manage your sales team's workload and ensuring that each opportunity is being actively pursued.
Customer Lifetime Value [CLV]
It measures the total value a customer brings to your business over their lifetime, helping you identify your most valuable customers and tailor your sales and marketing efforts accordingly.
New customers or accounts
It tracks the number of new customers or accounts, which helps you understand your customer acquisition rate and the effectiveness of your sales and marketing campaigns.
Average transaction value
It measures the average value of a transaction, helping you identify opportunities to increase sales revenue.
Leads by source
It measures the number of leads generated from each source, helping you identify the most effective lead-generation channels.
Sales opportunities
It tracks the number of open sales opportunities, helping you identify the potential revenue growth and optimize your sales pipeline.
Lead response time
It measures the time it takes for your sales team to respond to a lead, helping you improve your lead nurturing process and increase your chances of closing the sale.
Sales cycle length
It measures the time it takes to close a sale, helping you identify areas for improvement in your sales process and optimize your pipeline.
Upsell revenue
It measures the revenue generated from upselling existing customers, helping you identify cross-selling opportunities and increase revenue per customer.
Steps for Designing an Effective Customized Sales Dashboard
Designing an effective customized sales dashboard requires careful planning and execution.
Here are the key steps to follow:
Define Objectives Clearly
Before designing your dashboard, define your objectives clearly, such as what you want to achieve, the key performance indicators (KPIs), and the metrics to measure your progress.
Identify Key Metrics
Identify the key metrics that align with your objectives and are relevant to your sales team. Focus on metrics that will help you track progress, identify gaps, and make informed decisions.
Pick Sales Metrics Dashboard
Select a dashboard platform that is easy to use, integrates with your data sources, and provides the necessary functionality to create the dashboard that meets your requirements.
Plan Dashboard Usage
Plan the usage of the dashboard, including who will have access to it, how often it will be updated, and what actions will be taken based on the insights generated.
Develop New Dashboard
Create a new dashboard or customize an existing one to meet your needs. You can choose from various templates, widgets, and visualizations that make it easy to present data in an informative and engaging way.
Incorporate Relevant Metrics
Incorporate the metrics you identified earlier into the dashboard, ensuring they are presented clearly and easily. Use charts, graphs, and other visualizations to highlight trends and patterns.
Design Data Presentation
Design the dashboard to present data visually appealingly, using appropriate color schemes, font sizes, and icons. Ensure the dashboard is easy to navigate and that users can quickly find the information they need.
Analyze Dashboard Reports
Regularly review the dashboard reports to identify trends, patterns, and opportunities. Use the insights generated to make data-driven decisions that help you achieve your sales objectives.
Share Dashboard with the Team
Share the dashboard with your sales team and stakeholders, providing them with the necessary training and support to ensure they can use it effectively. Regularly review usage and feedback to continuously improve the dashboard and meet the needs of your team.
Sales Dashboard Examples
Sales dashboards come in different types to cater to various business needs. Here are some sales dashboard examples:
Activity tracking Dashboard
This type of dashboard tracks sales team activities like calls, emails, meetings, and demos. It helps in monitoring individual and team productivity and identifying areas for improvement.
Lead management dashboard
This dashboard tracks leads throughout the sales funnel and helps in managing them effectively. It provides insights into lead sources, conversion rates, and deal size.
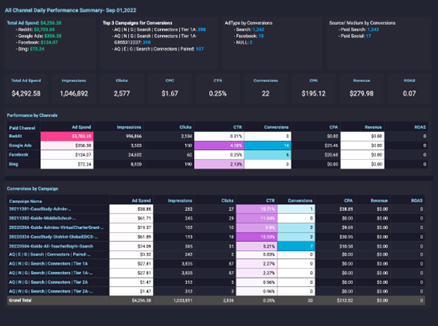
Sales Conversion Rate Dashboard
This dashboard focuses on the conversion rate of sales opportunities. It helps identify factors affecting conversion rates, such as sales team performance, product pricing, and marketing efforts.
Performance tracking dashboard
This sales performance dashboard tracks metrics like revenue, profit, and customer acquisition cost. It helps in identifying trends and setting targets for improvement.
Deal progress dashboard
This dashboard tracks the progress of ongoing deals, including deal size, close date, and deal stage. It provides insights on potential deal delays and helps in prioritizing follow-up actions.
Time-Tracking Sales Dashboard
This dashboard helps sales teams in managing their time effectively. It tracks time spent on different sales activities and helps in identifying time-wasting tasks.
Product Overview dashboard
This dashboard provides an overview of product performance, including revenue, margins, and customer feedback. It helps in identifying product strengths and weaknesses.
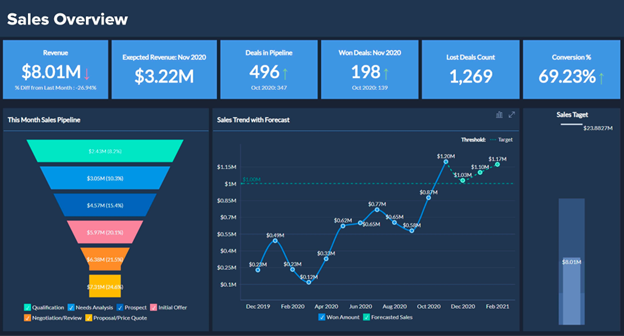
Sales analytics dashboard
This dashboard provides detailed analytics on sales data, including revenue by product, customer, region, and channel. It helps in identifying growth opportunities and setting targets for improvement.
Sales Manager Dashboard
This dashboard is designed for sales managers and provides a comprehensive view of sales team performance. It tracks team performance metrics, individual performance, and progress toward targets.
Customized dashboards
Businesses can create customized dashboards that fit their specific needs. Customization allows businesses to track unique metrics, set specific goals, and focus on areas of priority.
Top Sales Dashboard Tools for Your Team
Arena Calibrate
Arena Calibrate is a powerful simulation tool that enables businesses to optimize their processes and improve decision-making. It offers a range of features for building and testing models of complex systems, as well as advanced analysis and optimization capabilities.
Unique Features
- Customizable Dashboards: Arena Calibrate offers customizable dashboards allowing sales teams to tailor the interface to their needs. Users can choose and arrange various sales metrics, reports, and visualizations to create a personalized view of their sales performance.
- Real-time Data Updates: The platform provides real-time data updates, ensuring that sales teams have access to the most current and accurate information. This feature enables quick decision-making and allows for monitoring sales activities and performance in real time.
- Sales Performance Tracking: Arena Calibrate is a comprehensive sales performance dashboard with tracking capabilities. Users can monitor key performance indicators (KPIs) such as revenue, pipeline metrics, conversion rates, and individual sales rep performance. This feature allows for easy identification of areas of improvement and tracking progress towards sales targets.
- Data Visualization: The tool offers robust data visualization features, including charts, graphs, and interactive visual representations of sales data. These visualizations make it easier to analyze complex sales data, identify trends, and communicate insights effectively.
- Forecasting and Predictive Analytics: Arena Calibrate includes forecasting and predictive analytics functionalities that help sales teams make informed decisions. By analyzing historical data and applying predictive models, the tool can provide sales forecasts, identify potential risks or opportunities, and assist in sales planning.
Plan Details
Arena Calibrate offers different plans depending on businesses' specific needs and requirements. You can get started for free with Arena Lite or make the most of our tool with the Pro Business and Pro Agency plans. Contact the team to know more.
Hubspot
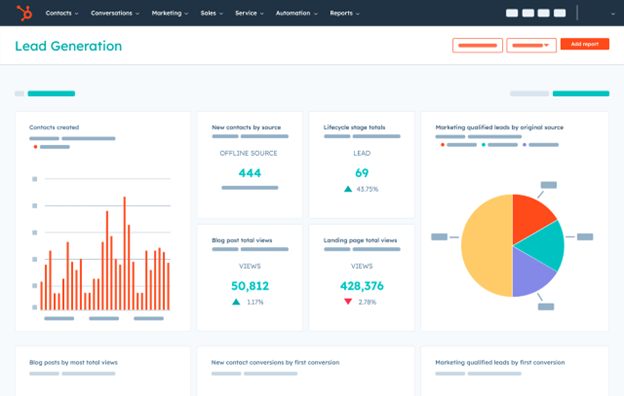
HubSpot is a leading CRM software offering various features for sales, marketing, and customer service. It provides a comprehensive platform for businesses to manage customer relationships, track sales performance, and automate marketing efforts.
Unique Feature
Some of the unique features of HubSpot include:
- All-in-one platform for sales, marketing, and customer service
- Free CRM with unlimited users and contacts
- Sales automation and lead scoring
- Marketing automation and analytics
- Customizable reporting and dashboard
- Integration with various third-party tools
Plan Details
HubSpot offers a variety of plans to fit the needs and budgets of different businesses, including a free plan with basic features and paid plans with more advanced functionality. Its paid plans range from $45 per month to $3,200 per month, depending on the number of contacts and the desired features.
HubSpot also offers add-ons and integrations at an additional cost.
Zoho Analytics
Zoho Analytics is a business intelligence and analytics software that allows businesses to create and share insightful reports and dashboards.
Unique Feature
- AI-powered insights to help users identify trends and anomalies
- Ability to connect to multiple data sources and combine data into a single report
- Collaboration and sharing features to allow team members to access and collaborate on reports
Plan Details
Zoho Analytics offers various plans, from a free plan to enterprise-level plans with more advanced features. Plans are based on the number of users and the amount of data storage required, with options to add additional users and storage as needed.
Klipfolio
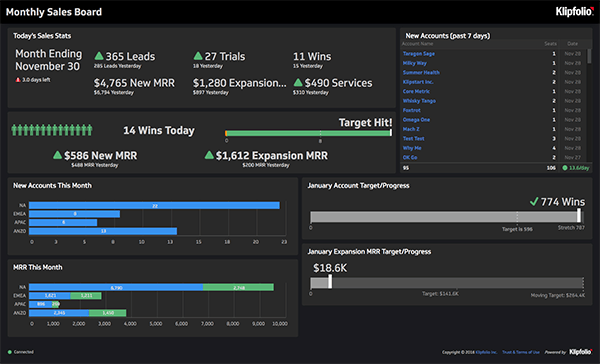
Klipfolio is a cloud-based dashboard software designed for creating custom visualizations and dashboards. It offers a wide range of integrations and data sources, including spreadsheets, databases, and cloud services like Salesforce and Google Analytics.
Unique Feature
Some of the unique features of Klipfolio include:
- Over 300 pre-built visualizations, including gauges, charts, and tables.
- Customizable dashboard building blocks, called "klips," that can be easily configured and styled to meet specific needs.
- An extensive library of pre-built dashboard templates that can be easily customized and shared.
Plan Details
Klipfolio offers a range of pricing plans, including a free plan that supports up to 3 users and 50 MB of data, as well as paid plans starting at $29/user/month that offer additional features and higher data allowances.
Datapad
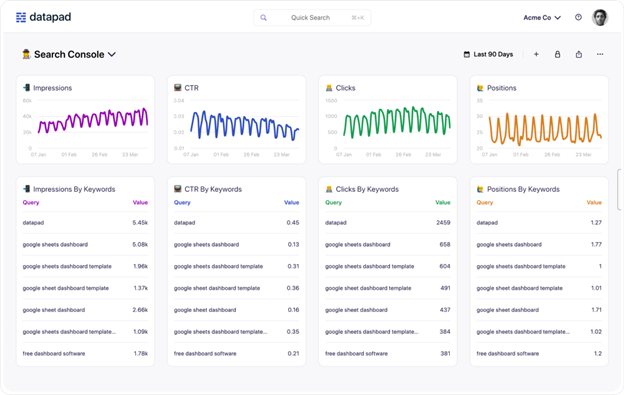
Datapad was designed from the ground up to be a mobile-first Key Performance Indicator (KPI) monitoring and dashboarding software for use by traveling sales leaders.
Unique Feature
- Dashboards and reports' visual styles may be modified using a simple drag-and-drop interface, with no coding necessary.
- Support for several well-known APIs, including those of Google Analytics, MySQL, Shopify, Facebook Ads, and others
- The software has a built-in capability for team collaboration and real-time chatting.
- Implement role-based administration to restrict dashboard access and real-time alerts for key performance indicators.
Plan Details
A very responsive mobile app complements the platform's zero-cost availability.
Databox
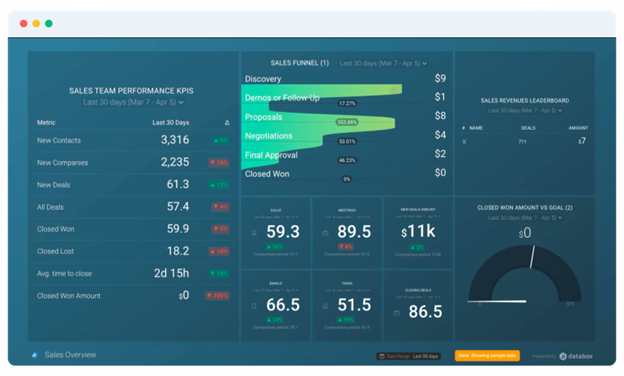
Unique Feature
- Ability to connect with over 70 different data sources.
- Mobile app for monitoring data and analytics on the go.
- Customizable templates and drag-and-drop editor for creating dashboards.
Plan Details
Databox offers a free plan with limited features, as well as paid plans that start at $49/month and offer additional features like more data sources, more data history, and custom metrics. The pricing varies based on the number of users and data sources needed.
Conclusion
In conclusion, creating a customized sales dashboard can provide your sales team with an intuitive and efficient way to track and analyze key sales metrics. By following the steps outlined in this guide, you can create a dashboard that is tailored to your team's specific needs and goals.
It is also recommended to use sales dashboard tools such as HubSpot, Zoho Analytics, Klipfolio, Datapad, and Databox to simplify the process and enhance data visualizations. Start building your own customized sales dashboard today to improve your team's productivity and performance.
FAQ on Sales Dashboards:
What are some mistakes that should be avoided while creating a sales dashboard?
Here are some common mistakes that should be avoided while creating a sales dashboard:
- Overcomplicating the dashboard with too much data
- Including irrelevant metrics that do not align with business objectives
- Not testing the dashboard with end-users before deployment
- Failing to keep the dashboard updated with the latest data
- Ignoring the importance of data visualization and design aesthetics
- Not providing sufficient context for the data presented
- Neglecting to consider data security and access permissions
- Not defining clear roles and responsibilities for managing and maintaining the dashboard.
Is it possible to customize a sales dashboard for individual team members?
Yes, it is possible to customize a sales dashboard for individual team members. Many dashboard tools allow for the creation of personalized dashboards for different users or user groups based on their specific roles, responsibilities, and data needs.
This can be beneficial as it ensures that team members have access to the data that is most relevant to their job function, improving their ability to make data-driven decisions.
What are some ways to evaluate the effectiveness of a custom sales dashboard?
There are several ways to evaluate the effectiveness of a custom sales dashboard:
- Data accuracy: For an effective dashboard, it is crucial to have accurate and up-to-date information.
- User feedback: Collecting user feedback is essential to understand the effectiveness of the dashboard. You can gather feedback through surveys or by observing user interactions.
- Goal achievement: To evaluate the effectiveness of a dashboard designed for specific goals, measure the progress towards those goals.
- Comparison with previous performance: By comparing current performance with previous performance, you can determine if the dashboard has contributed to any improvements.
- Usage metrics: By analyzing usage metrics like views, time spent, and frequency, you can evaluate dashboard effectiveness.
How frequently should a sales dashboard be updated?
The frequency of updating a sales dashboard depends on the specific needs and dynamics of the business. However, it is generally recommended to update the sales dashboard at least once a day or in real-time if possible. Regular updates ensure that the data in the dashboard remains accurate and up-to-date, enabling users to make informed decisions based on the most recent information available.


