Guess what came as a package deal along with the data deluge? The metrics maze.
Weekly and monthly reports have become flashier, powerpoints with more slides and PDFs with more pages.
That’s because with all the tools and platforms and channels, there is simply a lot marketers can measure. What's more, as a business matures and harvests more data, there is a tendency to keep adding to the metrics your business tracks. With each change in leadership, the new boss wants to play around with the reporting and tracking to put his or her stamp on the way things get done. Result? Legacy metrics, vanity metrics, too many —and all too often, with diminishing insight.
So how do you filter out noise and focus on the metrics that matter?
- Distill down your marketing objectives to 2 to 3 key bullet points.
- Identify leadership needs. Dozens of reports are sent up the ladder. Make sure yours stands out and answers their priorities.
- Summarize your report in a powerful Business narrative. “X wasnt working so we did Y to achieve Z”. Now cut down your slides to the stats that truly support your narrative.
An important distinction at this point–metrics measure tactical or platform performance. KPI’s measure performance relevant to your business goals. For example click through rates of a campaign is a metric. New Customer’s Acquisition per month is a KPI. So it’s good to structure your analytics such that you get an automated view of both KPis and tactical metrics..
So what are the few things you must absolutely measure?
There is no one single handbook or checklist that applies to every business. Your goals and priorities are uniquely your own.
Today’s platforms and tools track and generate tons of data. GA4 alone tracks over a 100+ data points Select the key metrics that inform your KPIs, deliver actionable business insights to your leadership, and create your reports as a succinct and memorable narrative.

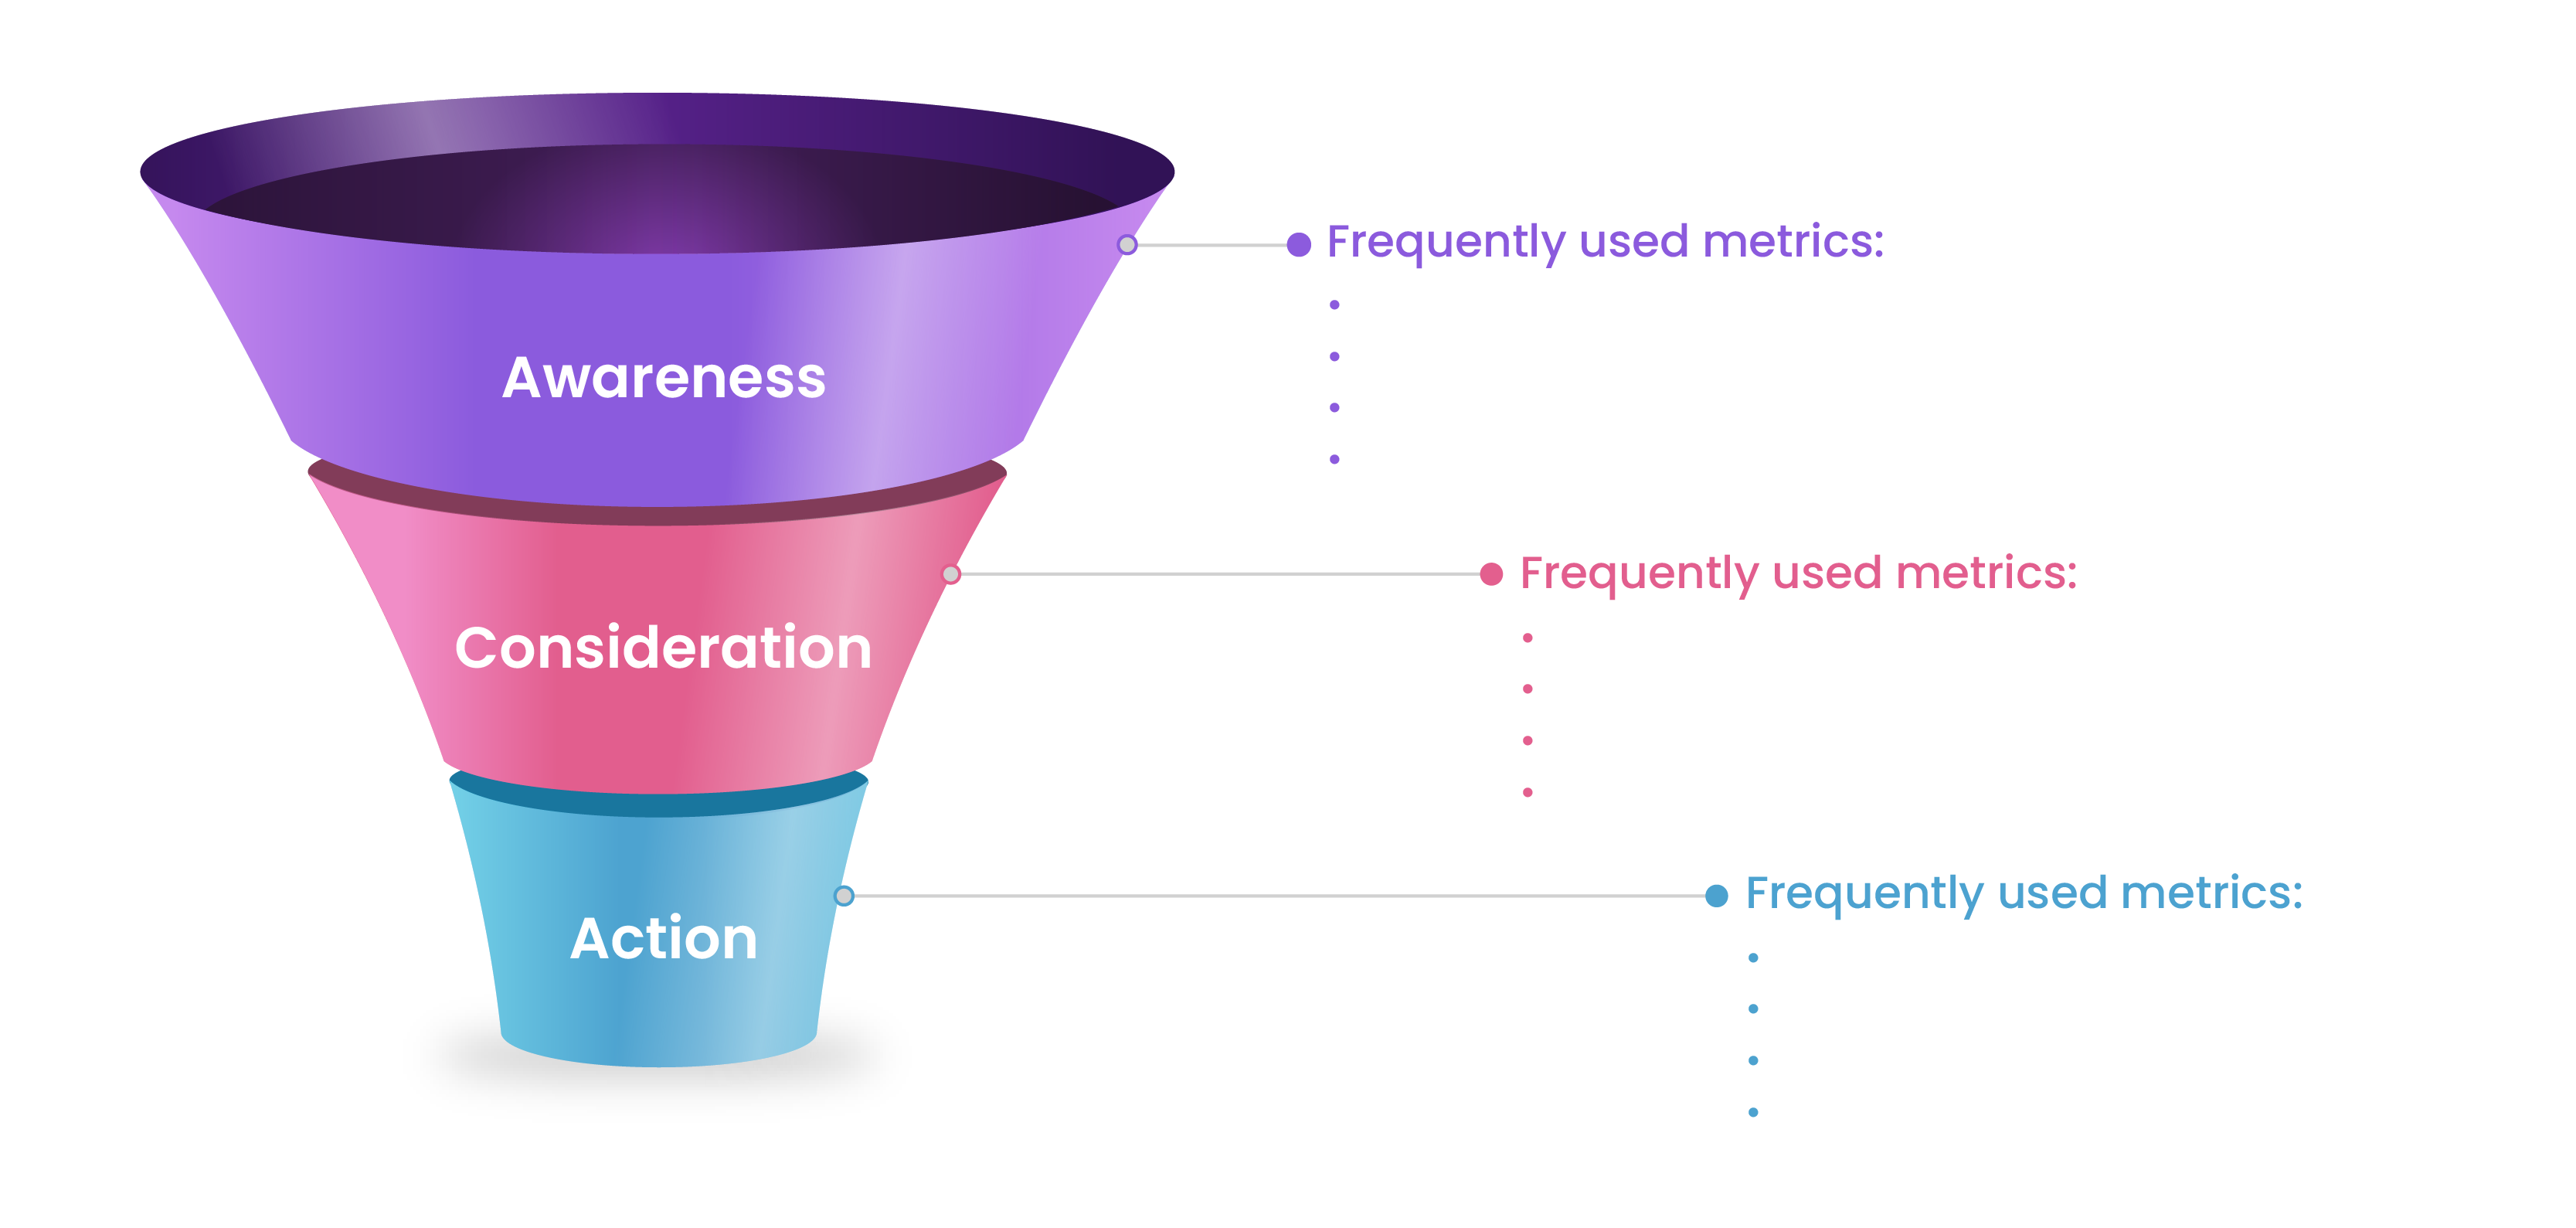
Some key metrics most businesses focus on, at different stages of the marketing funnel:
Awareness Stage: Traffic, Average Page views, Email Open Rates, Impressions CTRs
Engagement: Email Subscriptions, Social Likes, Comments and shares, Webinar sign ups.
Consideration Stage; CTRs, Subscription, Brochure Case study downloads, sign ups for demos, searches in store locator.
Action: Leads, Online and store transactions, Sign ups for loyalty programs, repeat purchases.
Key KPI’s can range from operational to high level:
- Conversion rates–This can be across several dimensions: Overall, Marketing channel, Landing Page, Campaigns, Ads, Keywords.
- CPC, CPA Customer Acquisition Rates
- Brand Sentiment Measures such as Net Promoter Scores, Customer Retention Rates
- ROI, ROAS, MER and
- Customer Lifetime Value
It’s time to unclutter your metrics reporting and as Marie Kondo said, keep only what sparks joy, not the metrics and slides that cause confusion.
Data-Metrics-Insight. 3 steps to calibrate your digital marketing.
Data and metrics are not an end in themselves, You need near real time insights that help calibrate your campaigns and improve your ROI. Leading Digital Marketers are using Arena Calibrate dashboard to track 360 marketing performance and automate their reporting. Test Drive it for free for 4 whole weeks, and you will wonder how you managed without it.
You can discover more about the power of Arena Calibrate in thes blog posts:
How to select a marketing dashboard that’s the perfect fit for your business and budget:
Enterprise Marketing Dashboards and The Goldilocks Paradox
How to save time and money and free up your digital marketing teams
How Arena Calibrate's Automated Google Ads Insights Saves Me Hours And Earns Profits


