Part 1
As a marketer, you probably have a dashboard or two on your laptop with the tabs always open.
But what if I told you there's more to building a marketing analytics dashboard than just putting together some charts?
It isn't as easy as it sounds and requires planning and technology to work. In this post, we'll explore how building a comprehensive marketing analytics dashboard works from start to finish: from data connectors and data warehouses to training employees on how to actually use the tool.
Step one: Data Connectors
Data connectors are software intermediaries that connect your data sources to your data warehouse. They're a critical part of any analytics solution, but they can be expensive and complex to install and maintain.
How do you build a cost-effective solution for connecting multiple systems? You need to use services like Fivetran and develop custom API connectors for niche data sources. These connectors allow you to specify which tables and fields to include from each data source in the destination data warehouse.
Next: Data Warehouse
The data warehouse is a central repository for all of your marketing data. You use it to store data from multiple sources, and it's a single point of truth for that information.
Data warehouses are also used to store historical records—like how many people signed up for an e-mail newsletter in July 2022 or how many times they clicked on an ad in August 2022.
3. Rectify Incorrect Dashboard Reporting
The biggest problem with dashboards is inaccuracy. Errors creep in due to various factors, such as bad reporting, data collection, and data analysis. Before making effective decisions, you need to know where your data comes from and how trustworthy it is.
Incorrect reporting occurs when there are inaccuracies in how information is collected or reported. Some examples:
- Wrong metrics calculation (e.g., total revenue/net profit) due to rounding errors or other factors. This would result in an inaccurate picture of your business.
- Incorrect interpretation of metric values (e.g., conversion rate) based on assumptions about "normal" behavior; if those assumptions aren't correct, the reported value will not reflect reality.
Additionally, suppose you have fragmented information about specific events in time-series charts. In that case, it can be very difficult for analysts or marketers who need real-time insights into their business performance against industry benchmarks.
4. Resolve Fragmented Data
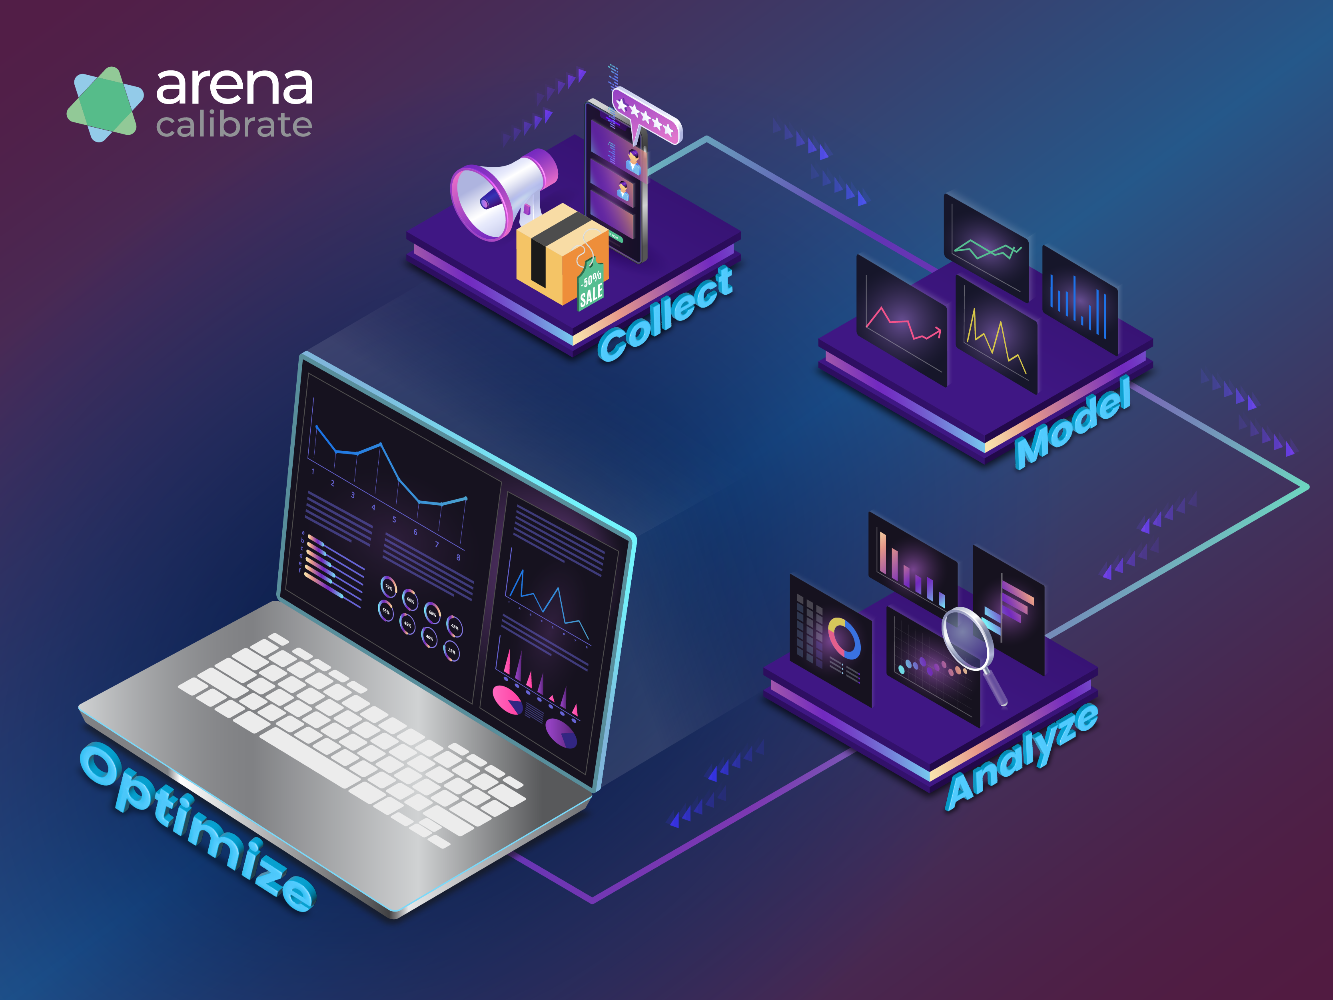
The first step in building your marketing analytics dashboard is gathering data from all sources and creating a coherent picture of your business.
But most data is fragmented and inconsistent. You know that from experience.
To get value from your data and insight into customer behavior, you need to compare them across time periods and channels to see trends over time (or even within one specific channel).
Some data may not exist anymore. Or two different sources may not represent the same thing (such as sales revenue) or are not comparable (such as two different websites).
You get the picture, don’t you?
5. Drive Data Transformation
Most data needs to be converted to be usable and compatible. Data transformation is a process of converting data from one format to another. It's also known as data mapping or data bridging, and it's required when the source data is not in the format needed for the target dashboard.
Data transformation can be done manually by users or automatically by software tools. For example, you might use Excel as an intermediary tool for processing your raw marketing analytics metrics into something more useful (like a standard spreadsheet). More complex cases will need you to build an API that allows you to send specific information directly into your data warehouses, like Snowflake using coding or scripting skills.
Data transformation allows you to map and connect your marketing analytics systems so that they can communicate with each other, creating an integrated approach that's easier to use than ever before.
In part 2 of this 2-part blog post, we will look at data integration, data loss, training, and infrastructure costs. Plus, invaluable learnings from two more client engagements. Stay tuned!