‘You can't improve what you don't measure.’ - Peter Drucker
This is a powerful quote that rings true, especially in the marketing realm. Marketing is a tough game, but those who rule the roost are the ones who understand every facet of their marketing ROI.
It’s what allows them to eliminate redundant marketing activity, prevent capital burn, and make their ads land with pinpoint accuracy.
And for those who don’t know their marketing ROI or even settle for having a rough estimate, they are the ones who bear the brunt of a misfiring marketing campaign that locks them in a struggle to find any real foothold in their industry.
Maybe Drucker was on to something: What can’t be measured can’t be improved.
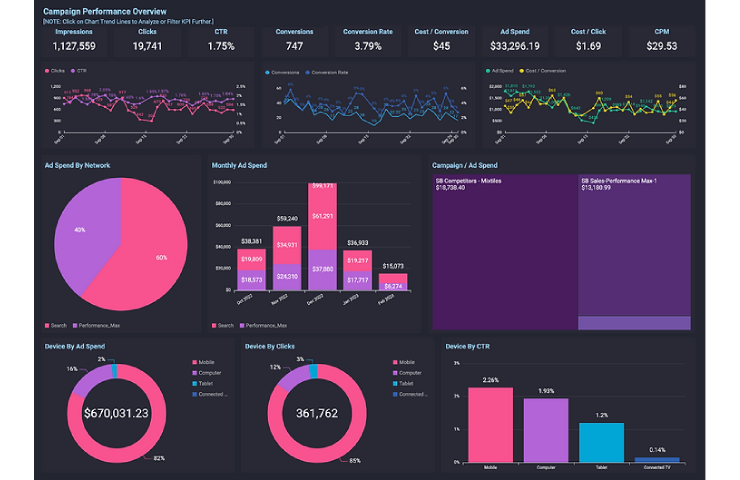
The cold reality is that you’ll never outfox your competition with a ‘hit and hope’ marketing strategy. Decision-making and strategy need to be built on data, requiring you to have a marketing dashboard that exposes even the most hidden aspects of your campaign’s performance.
This is the x-ray vision you need to visualize your marketing ROI and identify areas of weakness that will allow your marketing team to tighten any loose cogs in your marketing machine.
Well, in this blog, we’re going to reveal the crucial steps to creating a reporting dashboard that will reveal your marketing ROI from just a glance.
1. Define your key metrics to gain full visibility of your marketing performance
Your dashboard metrics will determine how close you’ll be to identifying your marketing ROI. Selecting the wrong ones will only skew the data and blind you to the realities of your campaign performance.
Marketing costs, customer lifetime value, website conversion rates, profit, and revenue growth – these are all important pieces of a jigsaw that will reveal the potency of your marketing efforts and allow you to home in on your market goals.
Here are some tips to help you choose the right metrics:
- Start with your business goals: Your business goals should guide your choice of metrics. Identify the key outcomes that you want to achieve through your marketing campaigns, such as increasing website traffic, generating leads, or improving customer retention. Then, choose metrics that align with these goals.
- Consider your audience: Your reporting dashboard should be tailored to your audience's needs. Consider who will use the dashboard and what information they need to make decisions.
- Use relevant, reliable data: Choose metrics that are relevant to your business, and that can be measured accurately and consistently over time. Avoid metrics that are difficult to measure or that do not provide meaningful insights.
- Keep it simple: Don't overload your reporting dashboard with too many metrics. Focus on the most important metrics that provide the most meaningful insights. Choose metrics that are easy to understand and can be presented clearly and concisely.
- Review and refine: Review your metrics regularly to ensure that they are still relevant and provide useful insights. Refine your metrics over time as your business goals and marketing strategies evolve.
2. Choose the right KPIs to keep you on track
Your KPIs are the measuring mechanism that will reveal if you’re on track to hitting your goals. But this has proven to be a real stumbling block for many businesses that struggle to match the right KPIs to their corresponding goals, steering them further away from their desired destination.
Suppose you've been having difficulty with measuring KPIs for your marketing goals, then not to worry! Here's a general overview of which KPIs should be measured for each marketing goal.
Goal: Increase website traffic
KPIs:
- Website traffic volume
- Bounce rate
- Time on site
Goal: Generate leads
KPIs:
- Conversion rate
- Cost per lead
- Lead quality
Goal: Increase brand awareness
KPIs:
- Social media engagement
- Reach
- Brand mentions
Goal: Improve customer retention
KPIs:
- Customer retention rate
- Net promoter score
- Repeat purchase rate
Goal: Increase sales revenue
KPIs:
- Sales revenue
- Conversion rate
- Average order value
3. Set up your data sources to feed your reporting dashboard with the relevant data
OK, so you’ve identified what metrics you want to track. Great. Now you need to set up your data sources to ensure that what you’re tracking is reliable, relevant, and accurate.
This is important because you want to preserve your data reservoir by connecting it with the correct data sources. Fail to do this, and you’ll dilute your dashboard with the wrong data, making it harder for you to measure the return on investment of your marketing activity.
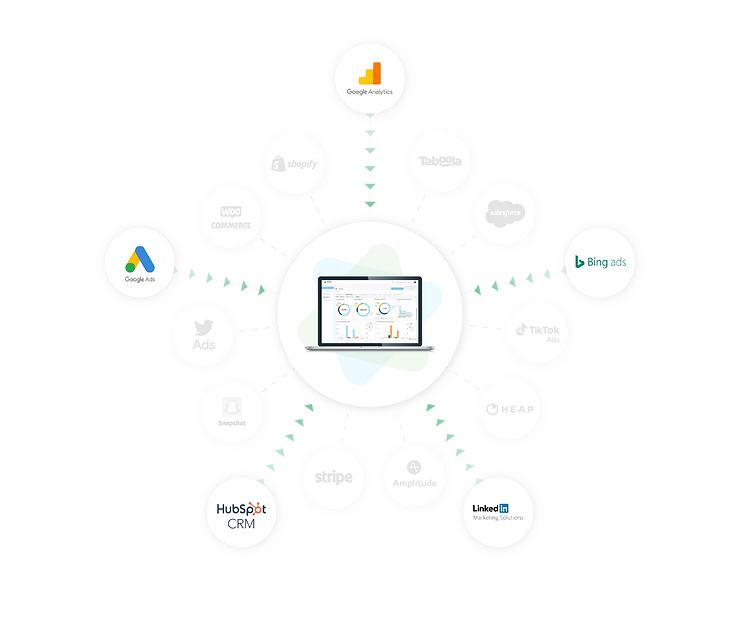
Based on your primary metrics, identify the data you wish to examine from your present data sources. For example, this may include Google Ads, Bing Ads, LinkedIn Ads, Google Analytics, and your CRM systems.
Once identified, it’ll be time to connect them to your dashboard, which can be done through APIs or by exporting the data to a format that can be imported into your reporting tool.
You’ll then need to take this one step further by automating your data collection to avoid pulling in stale data. You can do this by using tools like Fivetran which will save you a ton of time in the long haul as well as feeding your reporting dashboard with real-time insights.
If you're looking for a more comprehensive understanding of how this process works, you can find more information in another post we've written. Simply click here to access it.
4. Choose your reporting tool for faster decision making
Quick decision-making is built on accurate and up-to-date data - this is the holy grail for any effective marketing team, and it’s no wonder. Being agile and quick on your feet is what allows you to sidestep obstacles and pivot to new marketing strategies with ease.
But to do this, you need to choose the right reporting tool to give you a bird’s eye view of your digital marketing performance. To tap into the full potential of your data, select a reporting tool that has the following features:
- Data connectivity
- Customization and formatting
- Interactive reporting
- Real-time reporting
- Collaboration
- Security
- Integration
- Performance
- Mobility
Arena Calibrate rewards users with all of these features, along with a special support team that can even customize your dashboard for you.
Maximize Your Marketing ROI with a Customized Reporting Dashboard
Your marketing ROI is the compass that determines the direction of your ad campaigns. Ignore this, and everything will go south, forcing you to fly blind and navigate hesitantly through your industry, led by ineffective decision-making.
But thankfully, a customized reporting dashboard can shield you from this and crystallize your exact return on investment from your marketing efforts. When this happens, the blindfold is removed, and your next move becomes crystal clear.
It really boils down to this: why guess when you can rely on numbers and data?
By following the steps outlined in the article, you’ll be able to create a reporting dashboard that helps you visualize your marketing ROI with ease.
This will eliminate the pearls of guesswork and allow you to revel in the riches of rational decision-making that propels you closer to your goals.
Want to find out more about how to build a reporting dashboard to visualize your marketing ROI? Then we’d love to help out!
Simply mail us at calibrate@thearena.ai to get in touch with one of our team members to clarify all your doubts.