There’s a simple rule that applies to every heavyweight in their respective industry: those who best utilize their reporting dashboard are more likely to make the best decisions.
Dashboard errors bleed through to the decision-making process and point you in the wrong direction, which you will only have to pay for in capital and time - two commodities that we seem to have less of in 2023.
In a funny way, this is a great thing because most businesses aren't savvy when it comes to dashboard reporting, providing you with a golden opportunity for you to get a competitive edge in your industry.
Knowing what reporting mistakes to avoid will put you on the right trajectory and propel you closer to your goals. And with a looming recession and being in the middle of a shrinking economy, it's more crucial than ever that you know how to maximize the potential of your reporting dashboard.
Below we’re going to go over some of the most common dashboard blunders for you to avoid to keep you on the front foot in 2023 with a marketing campaign that's firing on all cylinders.
Ready to discover more?
Ok, let’s jump straight in!
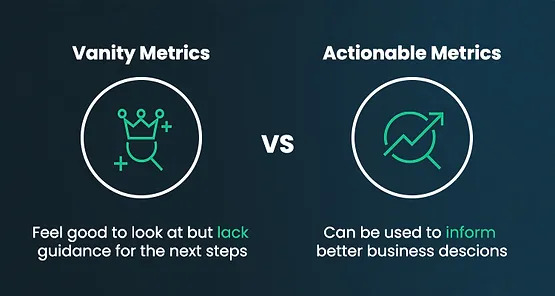
1. Focusing on vanity metrics
Vanity metrics are good on the eye and even on the ego but offer a small contribution to growth. You know, the ones that I’m talking about… the social media likes, the blog traffic, and even the open rates. That’s right, these ones.
They’re good to chase after because they do contribute to your overall growth strategy, BUT they aren't the championship-winning players that will give you the big wins in your marketing campaign.
Don’t obsess over them.
Instead, keep an eye on them but divert your focus on the important metrics that will determine the overall success of your marketing campaign. Jump into your Google Analytics. Analyze the data and pull out the custom metrics that will be most relevant to you. These will likely be:
- Conversion rate
- Return on investment (ROI)
- Cost per acquisition (CPA)
- Click-through rate (CTR)
- Engagement rate
- Traffic sources
- Time on site
- Bounce rate
- Customer lifetime value (CLV)
- Net Promoter Score (NPS)
‘Focusing on a single metric alone is considered a vanity metric. To truly evaluate performance, a comprehensive set of KPIs must be analyzed together. Simply having website traffic isn't enough, it's crucial to determine the specific keywords that are driving the traffic and assess whether they are actually resulting in conversions or sales.’
- Dave deCourcelle, Product Marketing Expert & Advisor
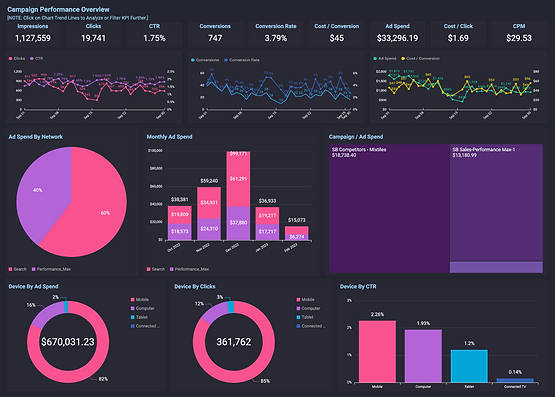
2. Overcomplicating the dashboard
A congested reporting dashboard stuffed with puffy metrics and striking percentages will confuse the eyes and boggle the mind. It’s overwhelming being bombarded with dashboard data, even if you’re a marketing expert.
Having to think about the meaning behind every metric will erode your focus and cloud your judgment, preventing you from discovering the true meaning behind the data. This puts you on the path to poor decision-making.
The reality is that not every metric deserves its own graph or table in dashboard reporting. If it’s a vanity metric, get rid of it. If it’s one that measures performance, put it at the forefront.
Here’s a rule of thumb for you to follow
Any relevant information should be found within 5 seconds. Structure their importance from top to bottom. To avoid confusion and information overload, don’t have any more than 7-9 visualizations in a single reporting dashboard.
Here are some tips on how you can organize your dashboard:
- Define your goals and KPIs: Before creating your reporting dashboard, define your goals and the key performance indicators (KPIs) that are most important to measure progress toward those goals. This will help you focus on the metrics that matter and avoid cluttering your dashboard with unnecessary information.
- Prioritize your metrics: Prioritize the metrics that are most important to achieving your goals and objectives. It's better to have a few high-impact metrics than a long list that don't provide much insight.
- Be clever with your data visualization: Use charts and graphs to visualize your data in a clear and concise way. Avoid using too many visual elements or complicated charts that can be difficult to interpret.
- Keep it simple: Avoid using complex jargon or technical terms that might confuse stakeholders who are not familiar with marketing metrics.
Note: Not sure how to even set up your dashboard? We have a post on that will give you some direction on how to build a comprehensive marketing analytics dashboard works from start to finish. Just click here on this link.
3. Not aligning the dashboard with business goals
The chances are that you’ll be using a whole range of different platforms in your digital marketing. For you to gain a firm grasp of your marketing activity, it’s fundamental that you’re able to pull data across different platforms such as Salesforce and Shopify, to align the dashboard with your overarching business goals.
Doing so will give you a holistic perspective of your marketing performance and create dashboard reports that allow you to make data-driven decisions.
To tie dashboard metrics to business objectives, you can follow these steps:
- Identify your business objectives: Start by identifying the main goals and objectives of your business. These could be increasing revenue, improving customer satisfaction, reducing costs, etc.
- Define your key performance indicators (KPIs): Once you have identified your business objectives, you need to define the KPIs that will help you measure progress towards those objectives. For example, if your objective is to increase revenue, your KPIs might include total revenue, average revenue per customer, and conversion rate.
- Choose relevant metrics: Once you have defined your KPIs, you need to choose the specific metrics that will be displayed on your dashboard. These metrics should be relevant to your business objectives and KPIs. For example, if your KPI is total revenue, you might choose metrics such as monthly revenue, revenue by product line, and revenue by region.
- Set targets: To make your dashboard meaningful, you need to set targets for each metric. These targets should be based on your business objectives and should be achievable.
- Monitor and analyze: Once you have set up your dashboard, you need to monitor and analyze the metrics on a regular basis. This will help you identify trends and patterns and make informed decisions to achieve your business objectives.
Failing to segment data
Data segmentation on a reporting dashboard is the process of dividing a large dataset into smaller, more manageable parts based on criteria. It’s a powerful method that allows you to enhance your data analysis by enabling you to dig deeper into insights of your customer base.
Like magic, you'll be able to understand the ins and outs of your customer base and spot trends and patterns that might be apparent when looking at the data as a whole. Doing so will maximize the accuracy of your marketing campaign, elevate your business performance and accelerate growth at a faster rate than before.
But to analyze data segmentation at a more granular level, there are a few key reasons why it's crucial in marketing:
- Personalization: marketers can tailor marketing messages and offers to specific customer groups based on their behavior, preferences, demographics, or other attributes.
- Optimization: data segmentation can also help marketers identify areas of their marketing funnel that may need optimization. By analyzing the performance of different segments, marketers can identify which segments are converting well and which ones may need more attention or a different approach.
- ROI: measuring the ROI of different marketing campaigns becomes a lot easier with data segmentation. Analyzing the performance of different segments allows marketers to identify which campaigns or channels are driving the most revenue or conversions.
Avoiding These Reporting Dashboard Errors Will Elevate Campaign Performance
The success of your marketing campaign hinges on how you utilize your reporting dashboard. If all the key variables are meshed in a hotchpotch of disconnected metrics and visualizations, you'll struggle to identify important shifts in your marketing campaign and keep your finger on the pulse of your target market.And here's what it all boils down to...
Your reporting dashboard needs to be optimized in a way that allows you to read the playing field and respond with data-driven decisions that improve the accuracy of your marketing campaign.
By avoiding the dashboard reporting errors outlined in the blog, you'll be equipped with invaluable insights that can help you elevate your marketing campaign and outperform your competitors.
And if you’re an agency, a fully optimized reporting dashboard will strengthen client relations and put you on the path for growth.
Want to know more about how to optimize your reporting dashboard? Then book your free consultation to discover how you can level up on your data analysis for a more powerful marketing campaign.