We’ve barely dipped our toes into 2023, and businesses are already feeling the impact of a volatile economy.
Over 85,000 tech sector jobs have been lost in the first few weeks of the year (MarketWatch, 2023). Economists predict that there’s a 70% chance of an oncoming recession (Bloomberg, 2023). And US corporate profits are expected to plummet by 14% (Schroders, 2022).
Times are already tough, and the squeeze will tighten.
As a consequence, marketing managers are feeling the pressure of having to make every penny count in their campaigns. Much of this hinges on having access to a high-impact marketing report that determines their next move.
It’s not just what they want, it’s what they need.
But for this to happen, the marketing report needs to go beyond the advice of highlighting what to do and what not to do. Yes, going over strengths, weaknesses, and key performance indicators is important, but these also need to be presented in a format that compels managers to pull the right levers.
The marketing report needs to persuade, stir emotion, and provide a clear plan of action that leaders will follow with conviction. Doing so demonstrates your value, making you more of an asset that the company can’t afford to cut loose.
To achieve this, you need to incorporate the three cornerstones that constitute a high-impact marketing report. Incorporating these elements will put you in a position of power that helps to transform a misfiring marketing campaign into one that hits the bullseye.
Ready to find out more?
Ok, let’s get straight into it.
Emphasize opportunity and back it up with marketing data
Decision makers demand transparency but also crave insights that give them hope. When you’ve highlighted an opportunity for growth, don’t just skip over it, emphasize it.
Key Point: You want your message to grab attention and be delivered in a format that persuades marketing managers to take action. Anything that fails to excite runs the risk of being ignored.
Here’s how to do it:
- Identify the opportunity: Start by clearly defining the opportunity you want to focus on. Avoid watery statements, be specific, and cultivate emphasis to create excitement about potential avenues for growth.
- Present the data to add weight to your statement: Use statistical analysis, graphs, and charts to help visualize and understand the opportunity.
- Highlight key findings: Summarize the key findings from the marketing data and use them to support your arguments about the opportunity.
- Provide actionable steps: Provide a step-by-step process on how key decision-makers can take advantage of the opportunity.
- Conclude with a strong statement: Conclude your report with a powerful conclusion highlighting the opportunity and the supporting data. This will make a lasting impact on readers and drive home the significance of the opportunity.
Leverage data storytelling to drive engagement
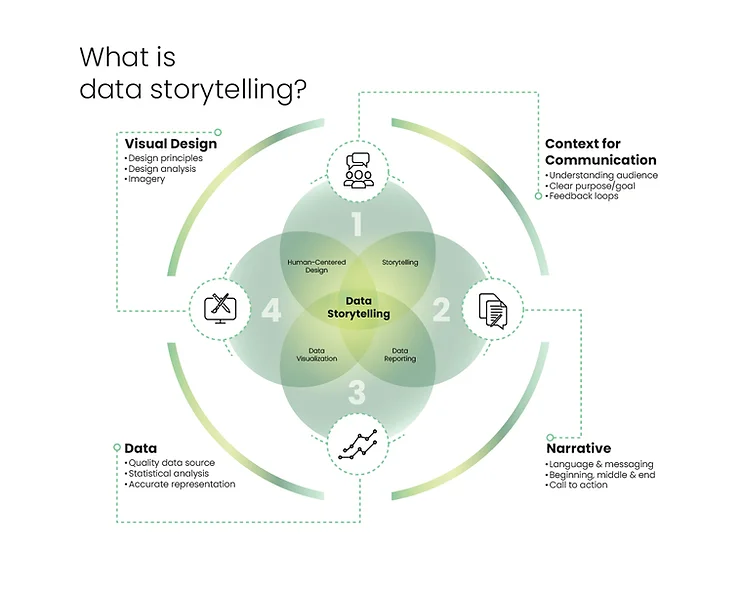
Studies show that people only retain 5% to 10% of information if it's made up of stats alone. But when these are woven into a story, they can remember between 65% and 70% (Marketing Words, 2022).
This is important because when you add meaning to your marketing metrics, it will create an emotional connection between the reader and the marketing data presented. And what does this lead to?
More engagement and increased data literacy, both of which will persuade marketing managers to take the action you want them to.
But for data storytelling to be impactful, you have to adopt a particular approach.
Key Point: Be bold. Elevate your value by revealing insights that your marketing manager might not be aware of. Shed light on matters that may initially be overlooked, justify its inclusion with detail, and bring it all to life with data visuals.
Achieving this will position you as a thought leader. Below are the key ingredients behind data storytelling to include in your digital marketing report:
- Characters: Having the marketing manager as the main character to represent the data will make the audience relate to it on a personal level.
- Plot: Using a plot in data storytelling can be an effective way to convey the insights and conclusions from a marketing report. One example would be to show the trend in customer behavior over time to identify patterns and correlations.
- Conflict: This is used to highlight the key challenges or obstacles that the marketing team is facing. An example would be to highlight a challenge or obstacle that the marketing team faced, such as change in customer behavior or a budget limitation.
- Setting: Provide a setting for the data, such as the industry or market, to help the audience understand the context and relevance of the information. In the context of a marketing report, you can highlight the specific geographic region in which the marketing campaign was conducted.
- Theme: Using a theme is an effective way to create a cohesive narrative that ties together the various insights and recommendations presented in the report. For example, if the marketing campaign was focused on sustainability, you could use this as a theme to highlight the various ways in which the company is promoting sustainability and to underscore its importance.
- Emotion: Tapping into the readers’ emotions is a powerful way to create a more engaging and memorable narrative that resonates with the audience. You can do this by highlighting the impact of the marketing campaign on customers, e.g., increased brand loyalty. Doing so will create an emotional connection with the audience and help to demonstrate the importance of the campaign.
- Resolution: Using a resolution in data storytelling will provide a sense of closure and emphasize the key insights and recommendations presented in the report. You can do this by providing a roadmap for future action. This will help readers to understand how to put your insights into practice.
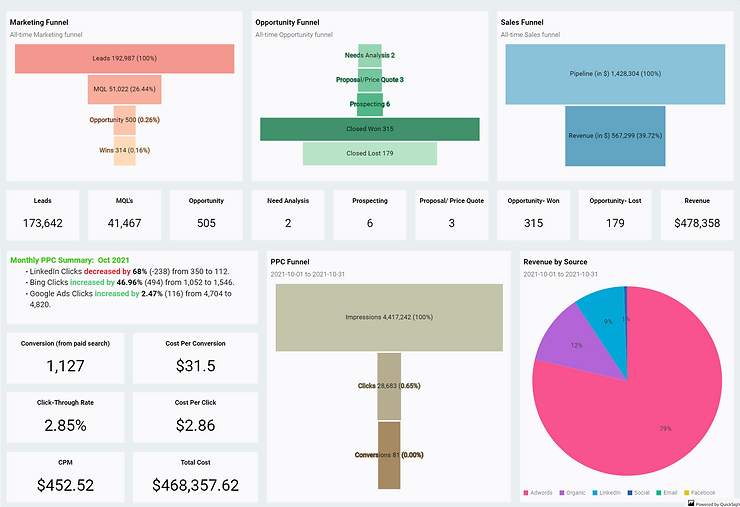
Use data visuals for transparency
Data transparency must be at the core of every marketing report. Anything that errs on the side of dishonesty will be found out, and that’s when the relationship will diminish.
Key Point: Avoid the temptation to distort facts in a way to suit an agenda that favors the narrative you want to push. The facts are there to be seen, not manipulated and are there for you to connect the dots in a way that’s easy for leadership teams to digest.
Using data visuals in a marketing report can emphasize transparency by providing clear and concise representations of data, making it easier for readers to understand and interpret the information being presented.
Tables
Evolve your current table formats with WOW, MOM, or YOY trend stats so anyone can see increases or decreases in the metrics over time. This enables a deeper analysis of data by providing a more detailed and specific view of performance and reveals key insights that can be used to identify opportunities for improvement and optimization.
For example, Tables can be used to display information such as:
- Conversion trends
- Search engine optimization rankings
- Market share
- Changes in Demographic data
- Survey results
- Spend or budget data
Pie charts
Pie charts provide fantastic visual contrasts between components of a whole for a fixed time frame. They are particularly effective when you want to show the distribution of data in a way that is easy to understand.
Some examples of when to use a pie chart in a marketing report include:
- Market share
- Demographic data
- Budget allocation
- Website traffic sources
- Customer satisfaction
Graphs
Use graphs when you want to illustrate trends, patterns, or relationships in data over a period of time. Some examples of when to use a graph in a marketing report include:
- Social media performance
- Increases & decreases in organic traffic
- Google Analytics insights
- ROI on PPC advertising campaigns. For example, you can use bar charts or stacked bar charts to compare performance across different PPC channels (e.g., Google Ads, Facebook Ads, LinkedIn Ads) to identify which channels are driving the most traffic, conversions, or revenue.
- Website traffic
- Performance overviews of different marketing channels
Multi-layered reporting
Multi-layered reporting allows you to provide stakeholders with the information they need in a format that’s easy to digest. In these cases, multi-layered reporting can be used to create a report that provides:
- High-level summaries: For executives and other stakeholders who need a quick overview of key metrics, such as sales figures, customer satisfaction, and marketing campaign performance.
- Detailed analysis: For marketing team members and other experts who need more detailed data and analysis of different marketing activities. This can include organic traffic trends, blog traffic, traffic metrics, and insights into paid advertising.
- Customized views: For different departments that require data to be tailored to their needs. Content managers, for example, will only be interested in data that covers content marketing.
Integrate each cornerstone to create a marketing report that raises your stock
As the economic environment becomes more cutthroat, impactful marketing reports have become even more crucial for leadership teams to generate higher ROI from their marketing efforts.
By incorporating the three cornerstones of a high-impact marketing report, not only will you effectively communicate your key findings, but you’ll do so in a way that inspires action.
Emphasizing an opportunity and unpacking it in detail will create excitement that draws the reader’s attention to your argument.
Backing it up with transparent data will make your findings more persuasive, also adding credibility to your marketing report. Then wrapping everything up with a compelling story will provide clarity and pull readers deeper into your investigation.
Include these cornerstones, and you’ll deliver a compelling marketing report. Provide many of them on a regular basis, and you’ll position yourself as a thought leader.